Business Performance Dashboard | Power BI
تفاصيل العمل
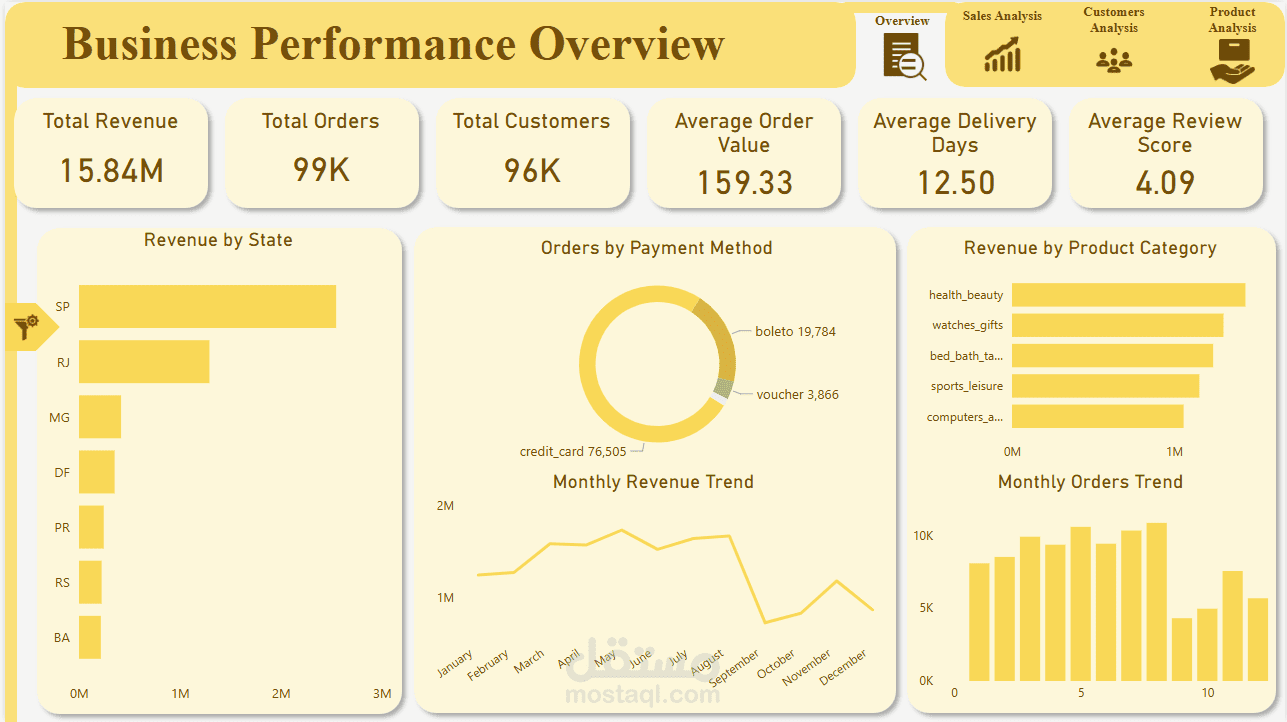
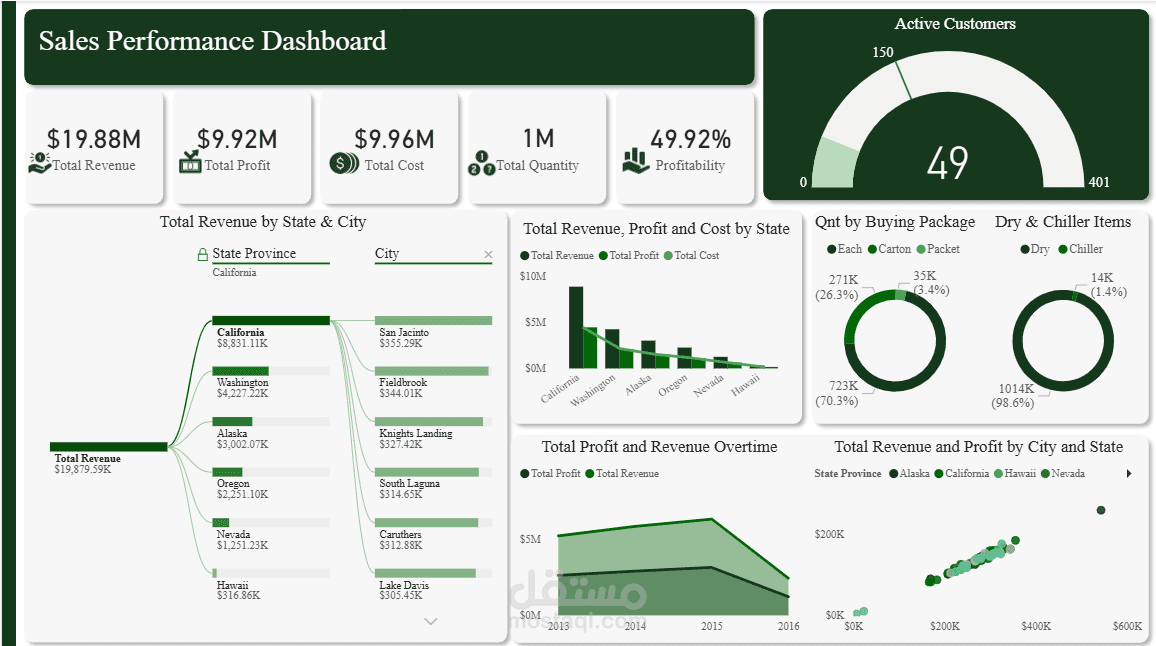
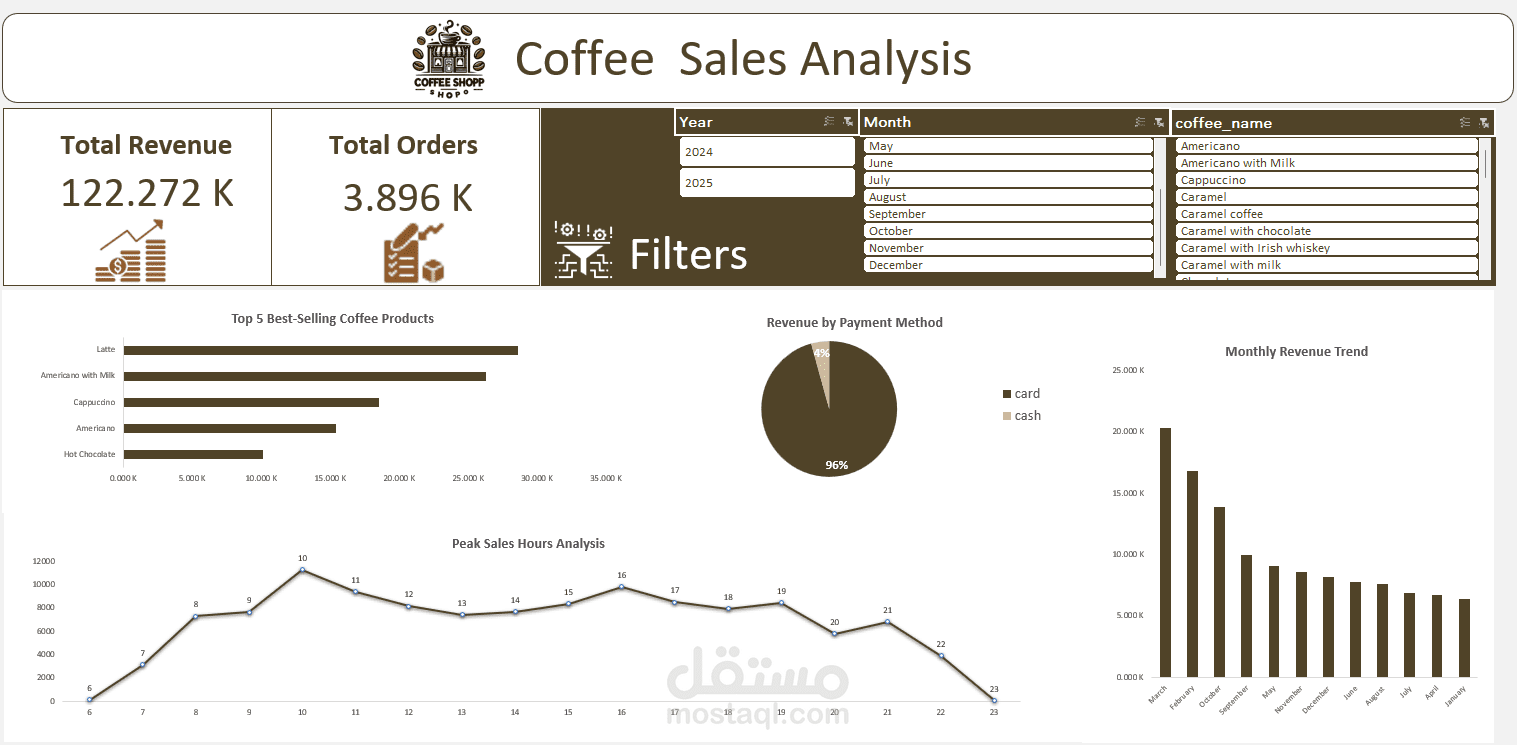
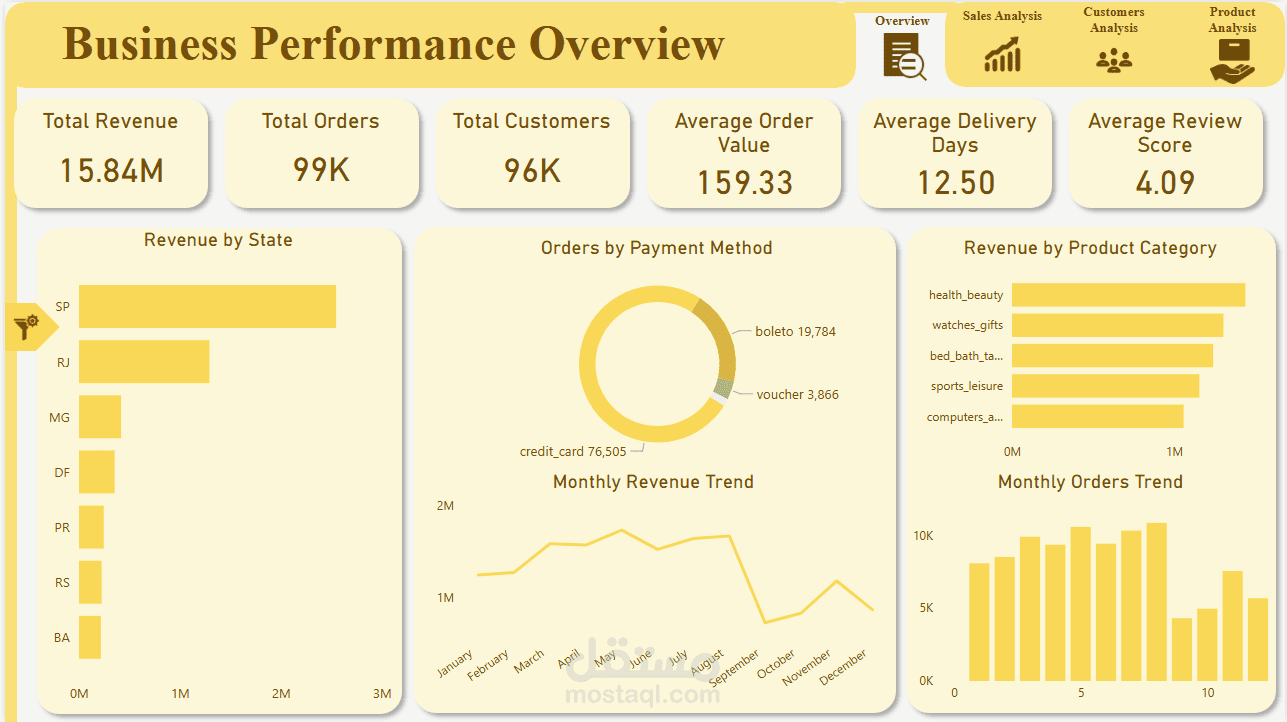
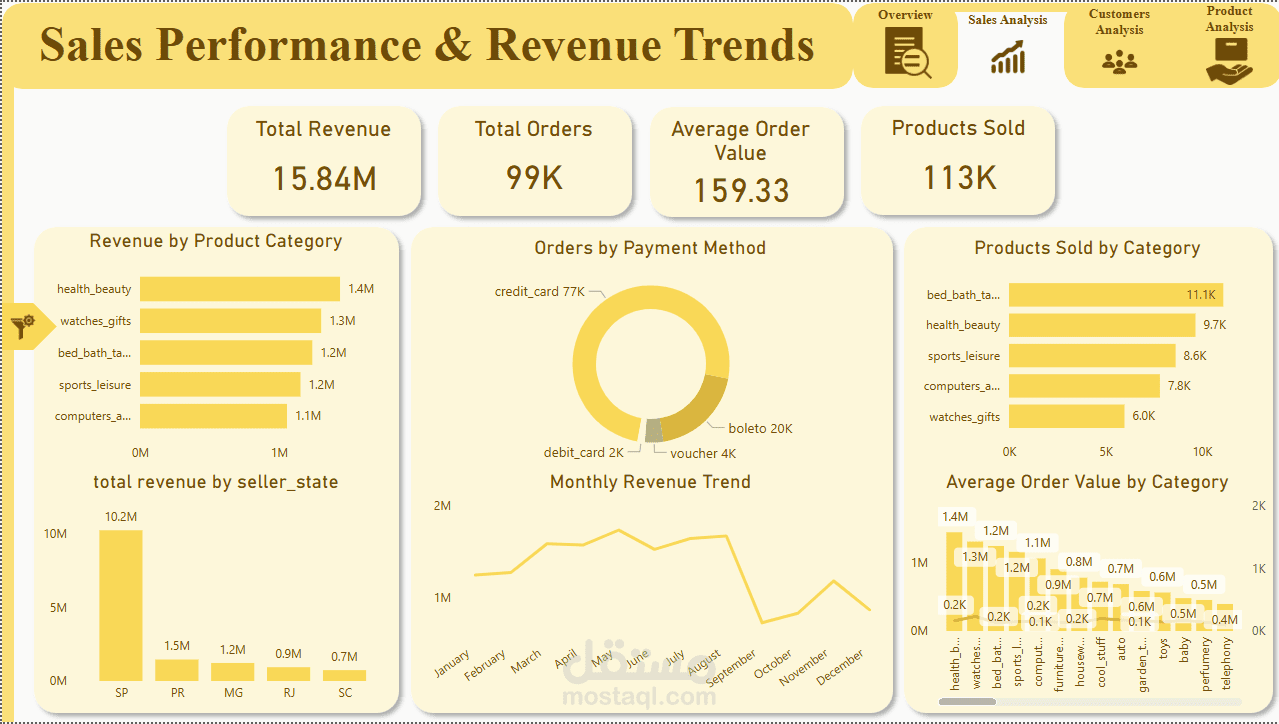
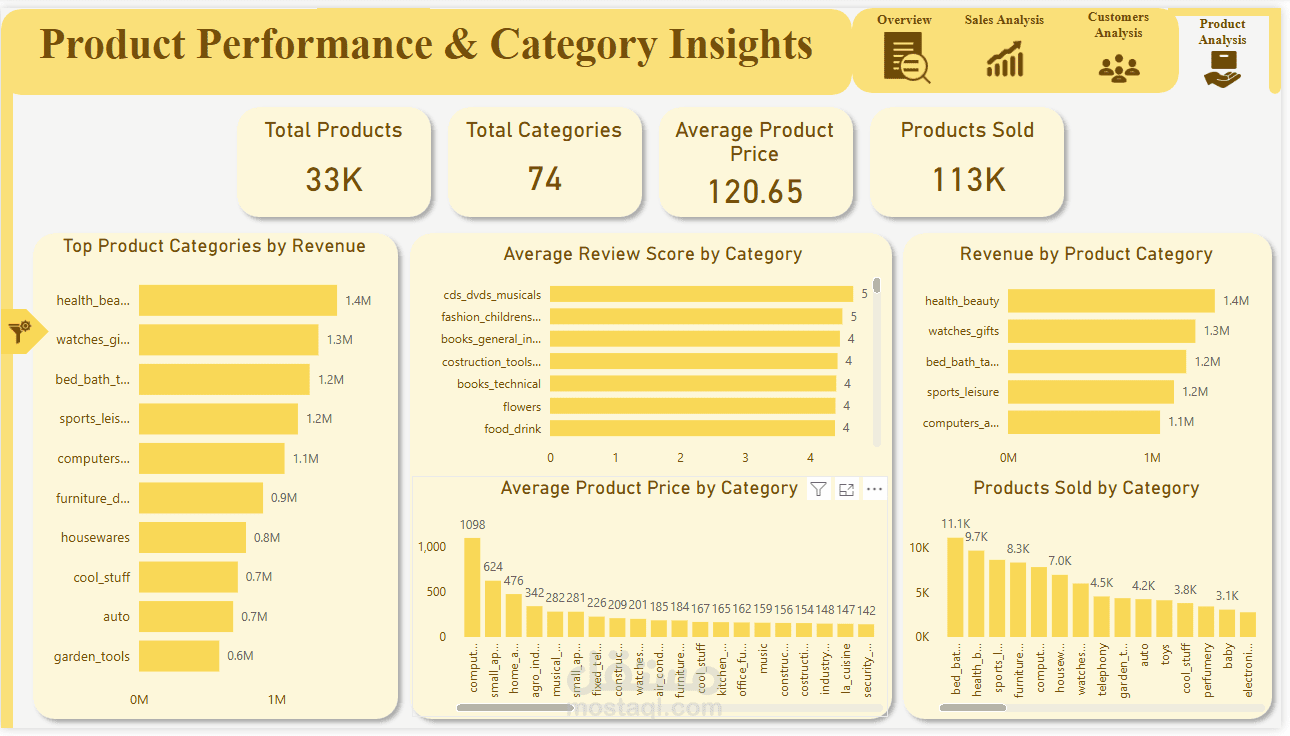
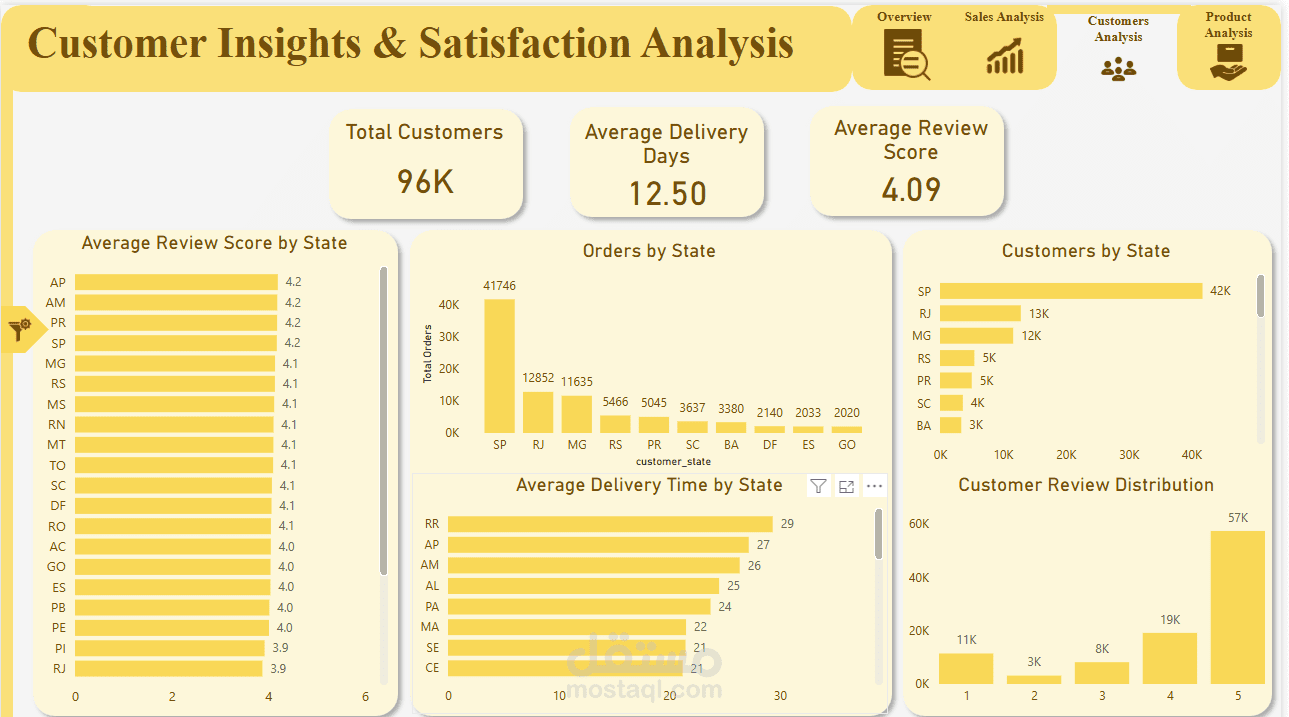
Designed and developed an interactive Business Performance Dashboard using Power BI to provide a comprehensive overview of business performance and support data-driven decision-making.
Key Features:
Business performance overview with key KPIs.
Total Revenue, Orders, Customers, Average Order Value, Average Delivery Days, and Average Review Score.
Revenue analysis by state.
Orders analysis by payment method.
Revenue analysis by product category.
Monthly revenue and orders trends.
Interactive navigation across multiple report pages (Overview, Sales Analysis, Customers Analysis, and Product Analysis).
Dynamic filtering for deeper business insights.
Tools & Techniques:
Power BI
Power Query
Data Modeling
DAX Measures
Interactive Dashboards
Data Visualization
This dashboard enables businesses to monitor performance, evaluate customer and sales trends, analyze product categories, and gain actionable insights through interactive visualizations.