Healthcare Insurance Data Visualization،
تفاصيل العمل
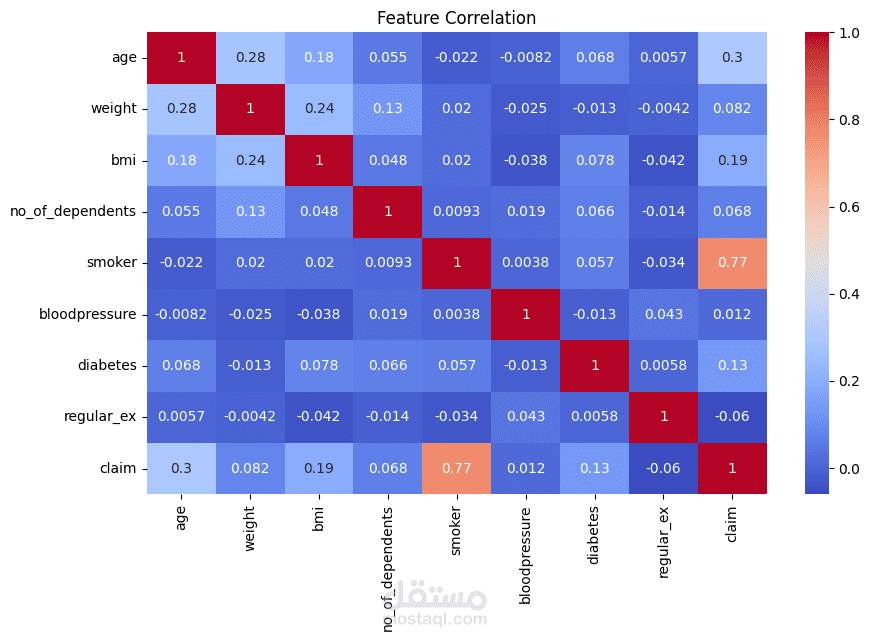
Performed an exploratory data analysis (EDA) and data visualization project on a Healthcare Insurance dataset using Python. The project involved data cleaning, identifying patterns and trends, and creating informative visualizations with Matplotlib and Seaborn. Various charts, including histograms, box plots, count plots, scatter plots, and correlation heatmaps, were used to explore relationships between age, BMI, smoking status, charges, and other features. The analysis provided valuable insights into the factors influencing healthcare insurance costs and demonstrated strong data visualization and analytical skills