Walmart Sales
تفاصيل العمل
🔹 Project Overview
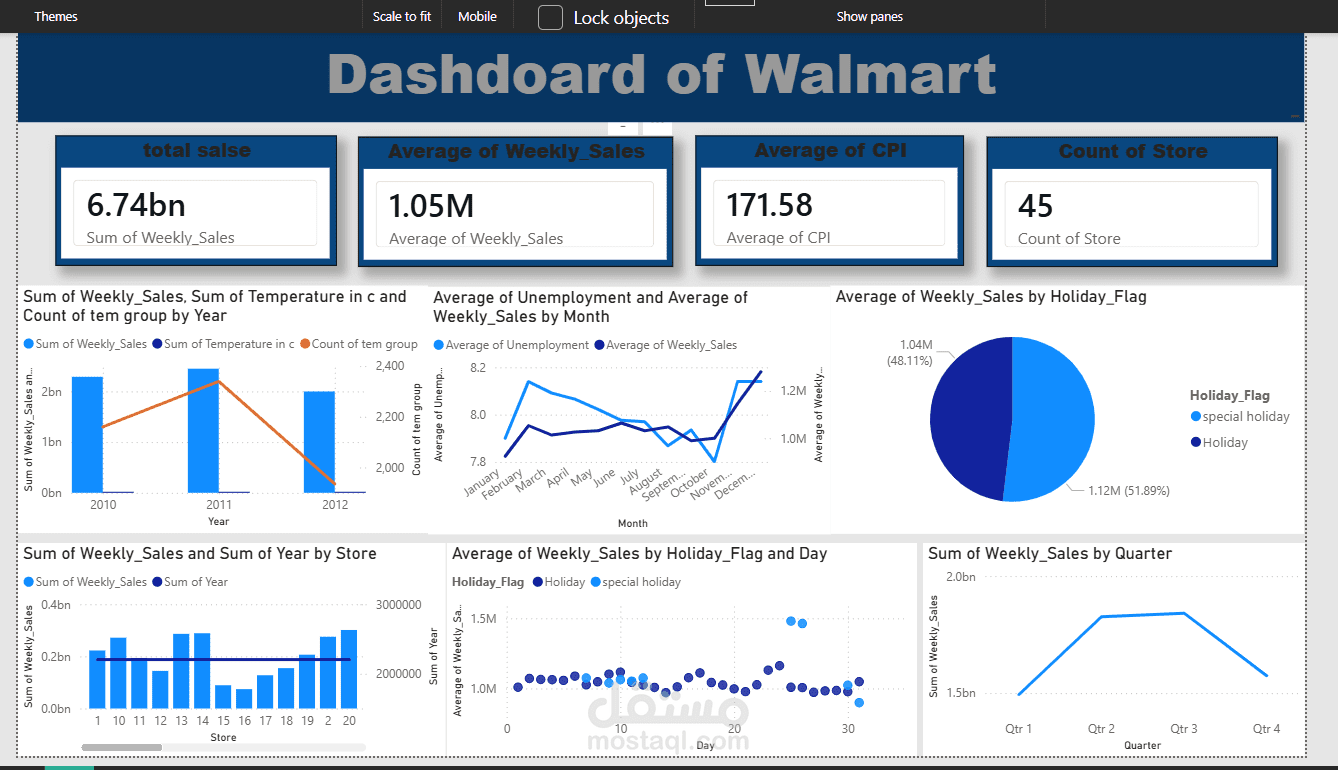
A strategic retail performance dashboard designed to analyze Walmart's weekly sales patterns alongside external macroeconomic factors and seasonal trends. It correlates historical revenue data across multiple retail locations with economic indicators like CPI and unemployment rates, enabling data-driven forecasting, resource planning, and seasonal marketing optimization.
🛠️ Tools
Data BI & Visualization: Power BI / Excel (Advanced multi-axis charting, economic indicator correlation, and time-series trend analysis).
📈 Outcomes
Macroeconomic Correlation: Successfully tracks a total sales volume of 6.74bn across 45 stores, mapping sales fluctuations directly against CPI averages (171.58) and monthly unemployment rates.
Seasonality & Holiday Impact: Evaluates revenue distribution during holiday periods, revealing that holidays account for 51.89% of performance trends compared to special holidays (48.11%).
Temporal & Environmental Insights: Uncovers quarterly and yearly sales trends alongside temperature fluctuations, identifying peak revenue quarters (Q2 & Q3) and localized store performance.