Blinkit E-Commerce Sales & Performance Dashboard
تفاصيل العمل
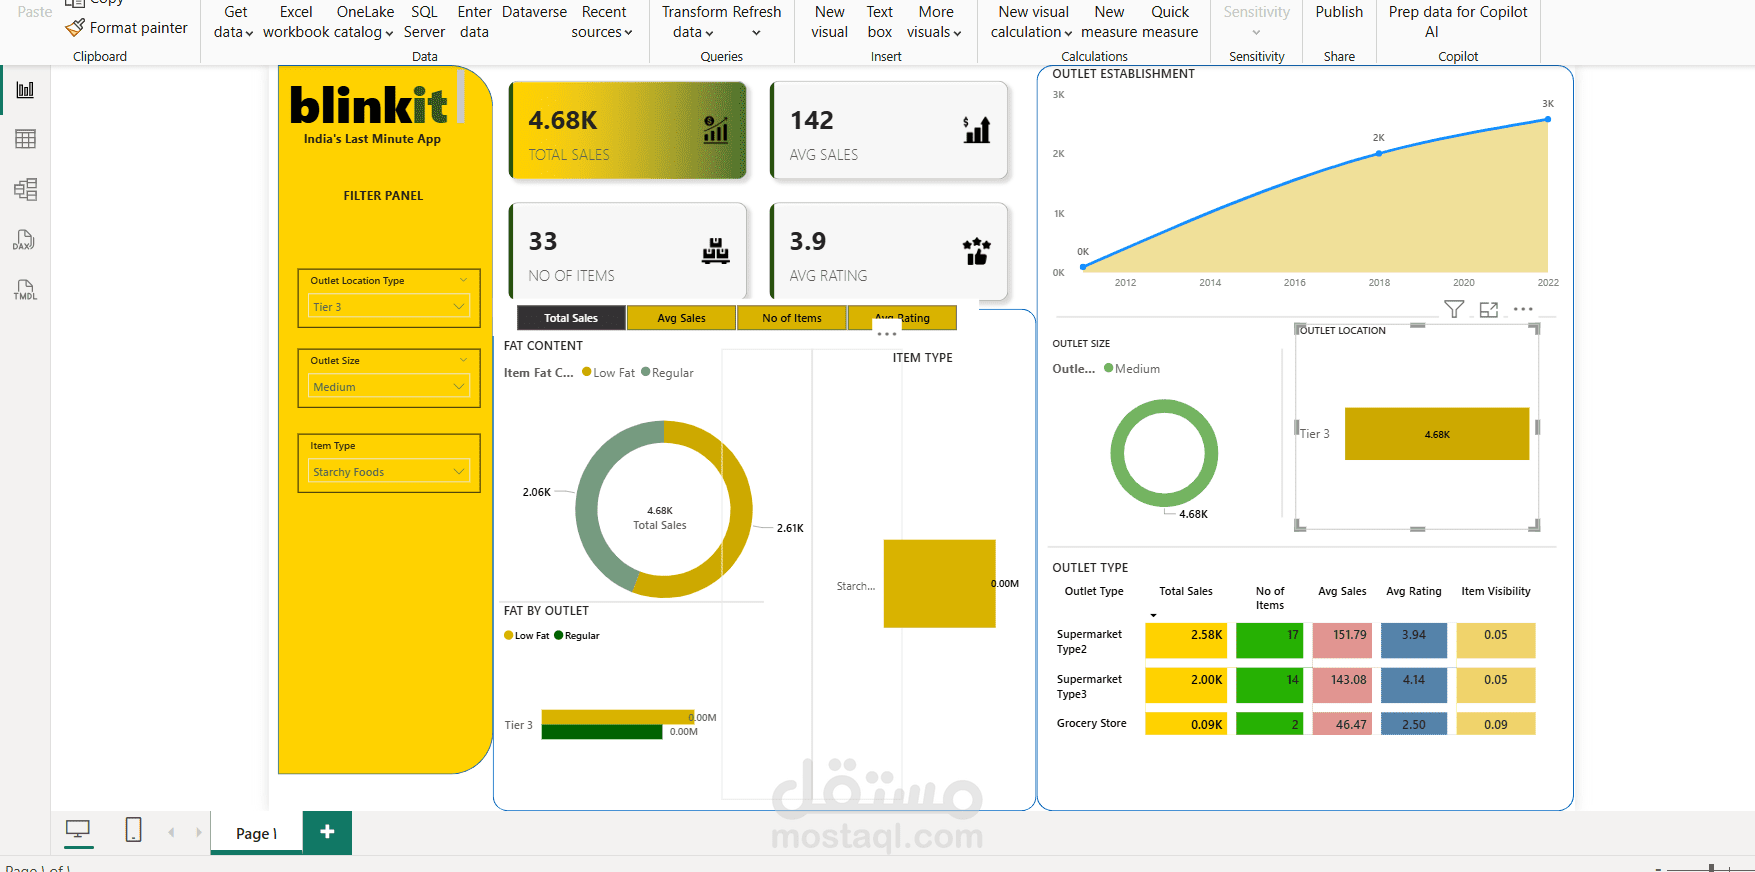
Project Overview:
A comprehensive data analysis dashboard for the popular grocery delivery app (Blinkit) to analyze sales performance, evaluate outlet efficiencies, and understand customer purchasing behavior to drive revenue growth.
Key Insights & Metrics:
* Overall Performance: Tracked $1.20M in Total Sales across 8,523 items with a solid 3.9 Average Rating.
* Product Analysis: Segmented sales by item types (such as Fruits, Vegetables, and Snacks) to identify top-performing categories.
* Outlet Evaluation: Compared different store sizes and locations (Tier 1, Tier 2, Tier 3) to discover the most profitable regions.
Tools Used: Power BI / Excel for data modeling and interactive visualization.