Interactive Sales KPI Dashboard in Microsoft Excel
تفاصيل العمل
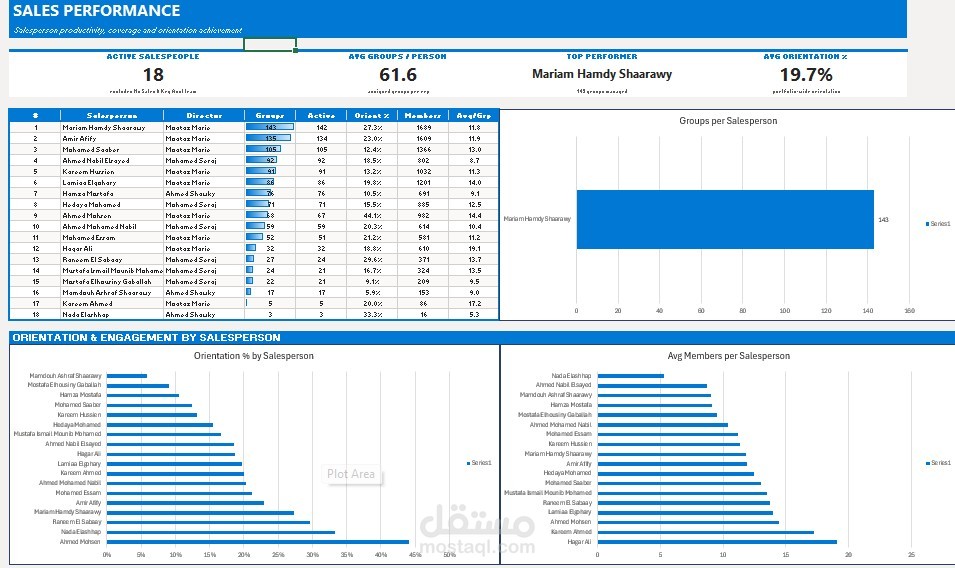
Designed and developed a professional Sales KPI Dashboard using Microsoft Excel to help businesses monitor sales performance and support data-driven decision-making.
The dashboard includes interactive charts, KPI cards, Pivot Tables, automated calculations, and dynamic filtering, allowing management to track revenue, conversion rates, sales pipeline, team performance, and monthly trends in real time.
Key Features:
• Executive KPI Dashboard
• Sales Performance Analysis
• Revenue Tracking
• Pipeline Monitoring
• Dynamic Charts
• Pivot Tables
• Automated Reporting
• Interactive Filters
Tools Used:
• Microsoft Excel
• Pivot Tables
• Power Query
• Advanced Excel Formulas
The solution reduced manual reporting efforts while improving reporting accuracy and visibility for business leaders.