PrimeMart Company
تفاصيل العمل
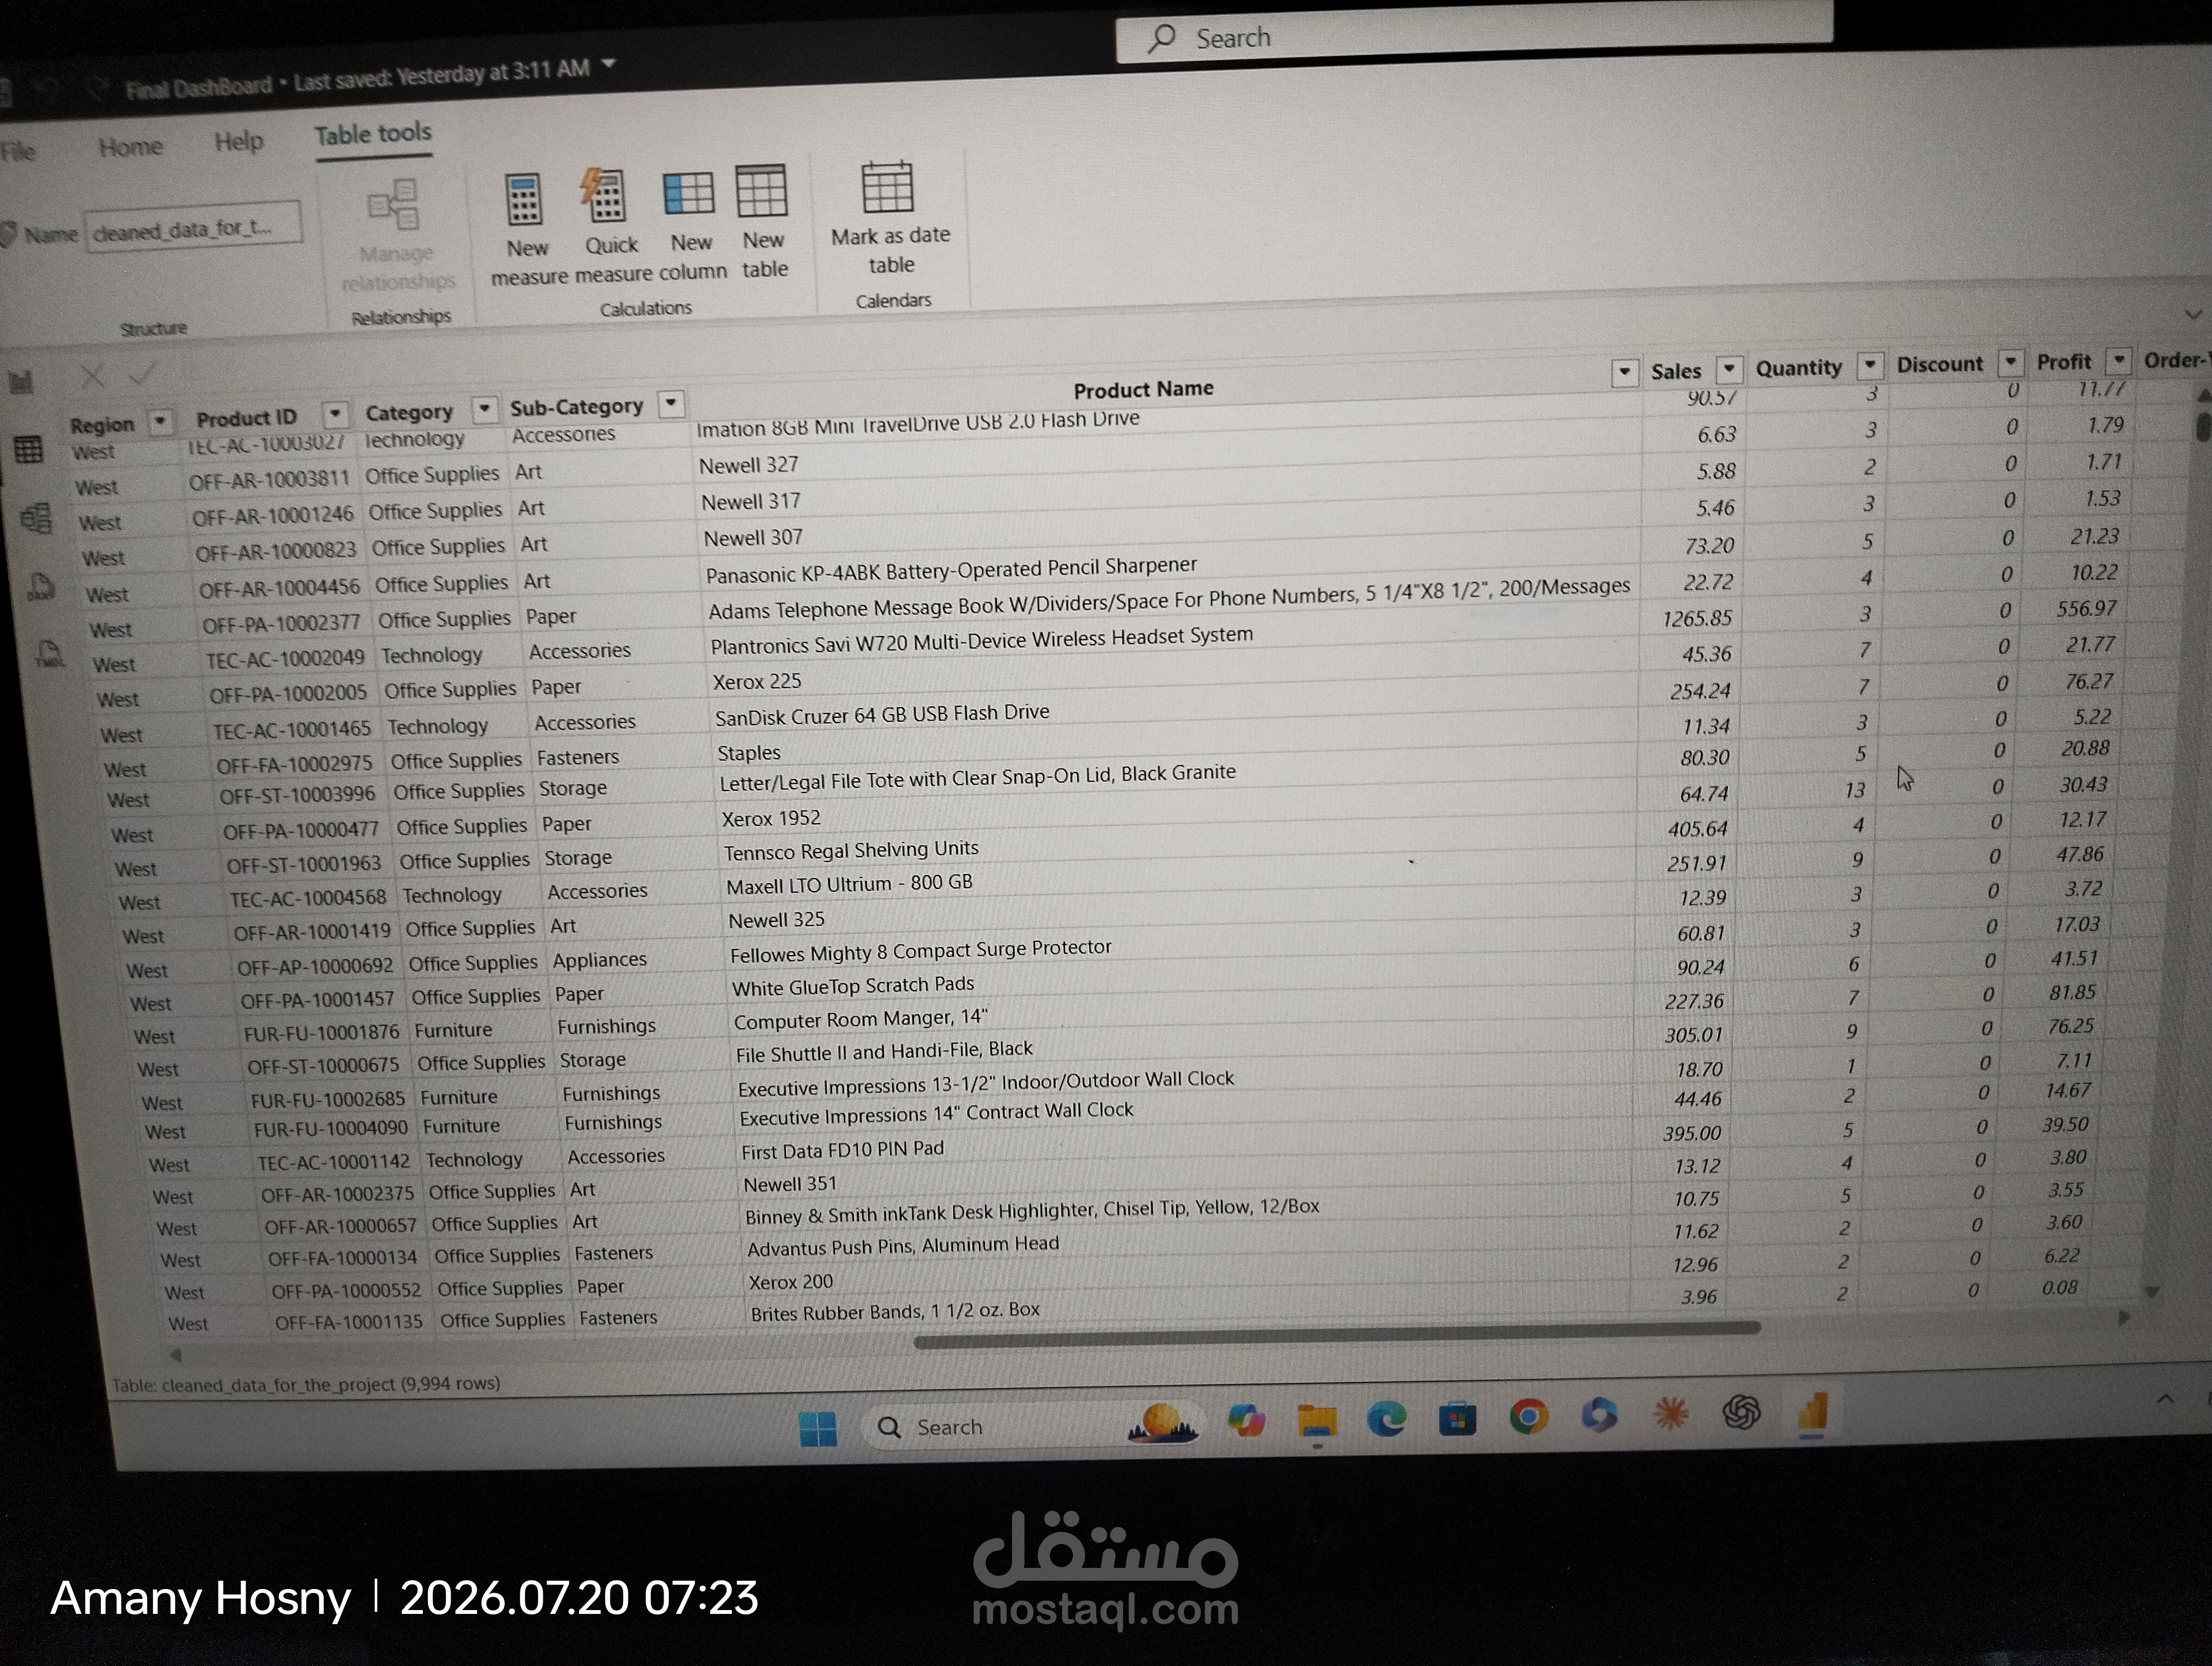
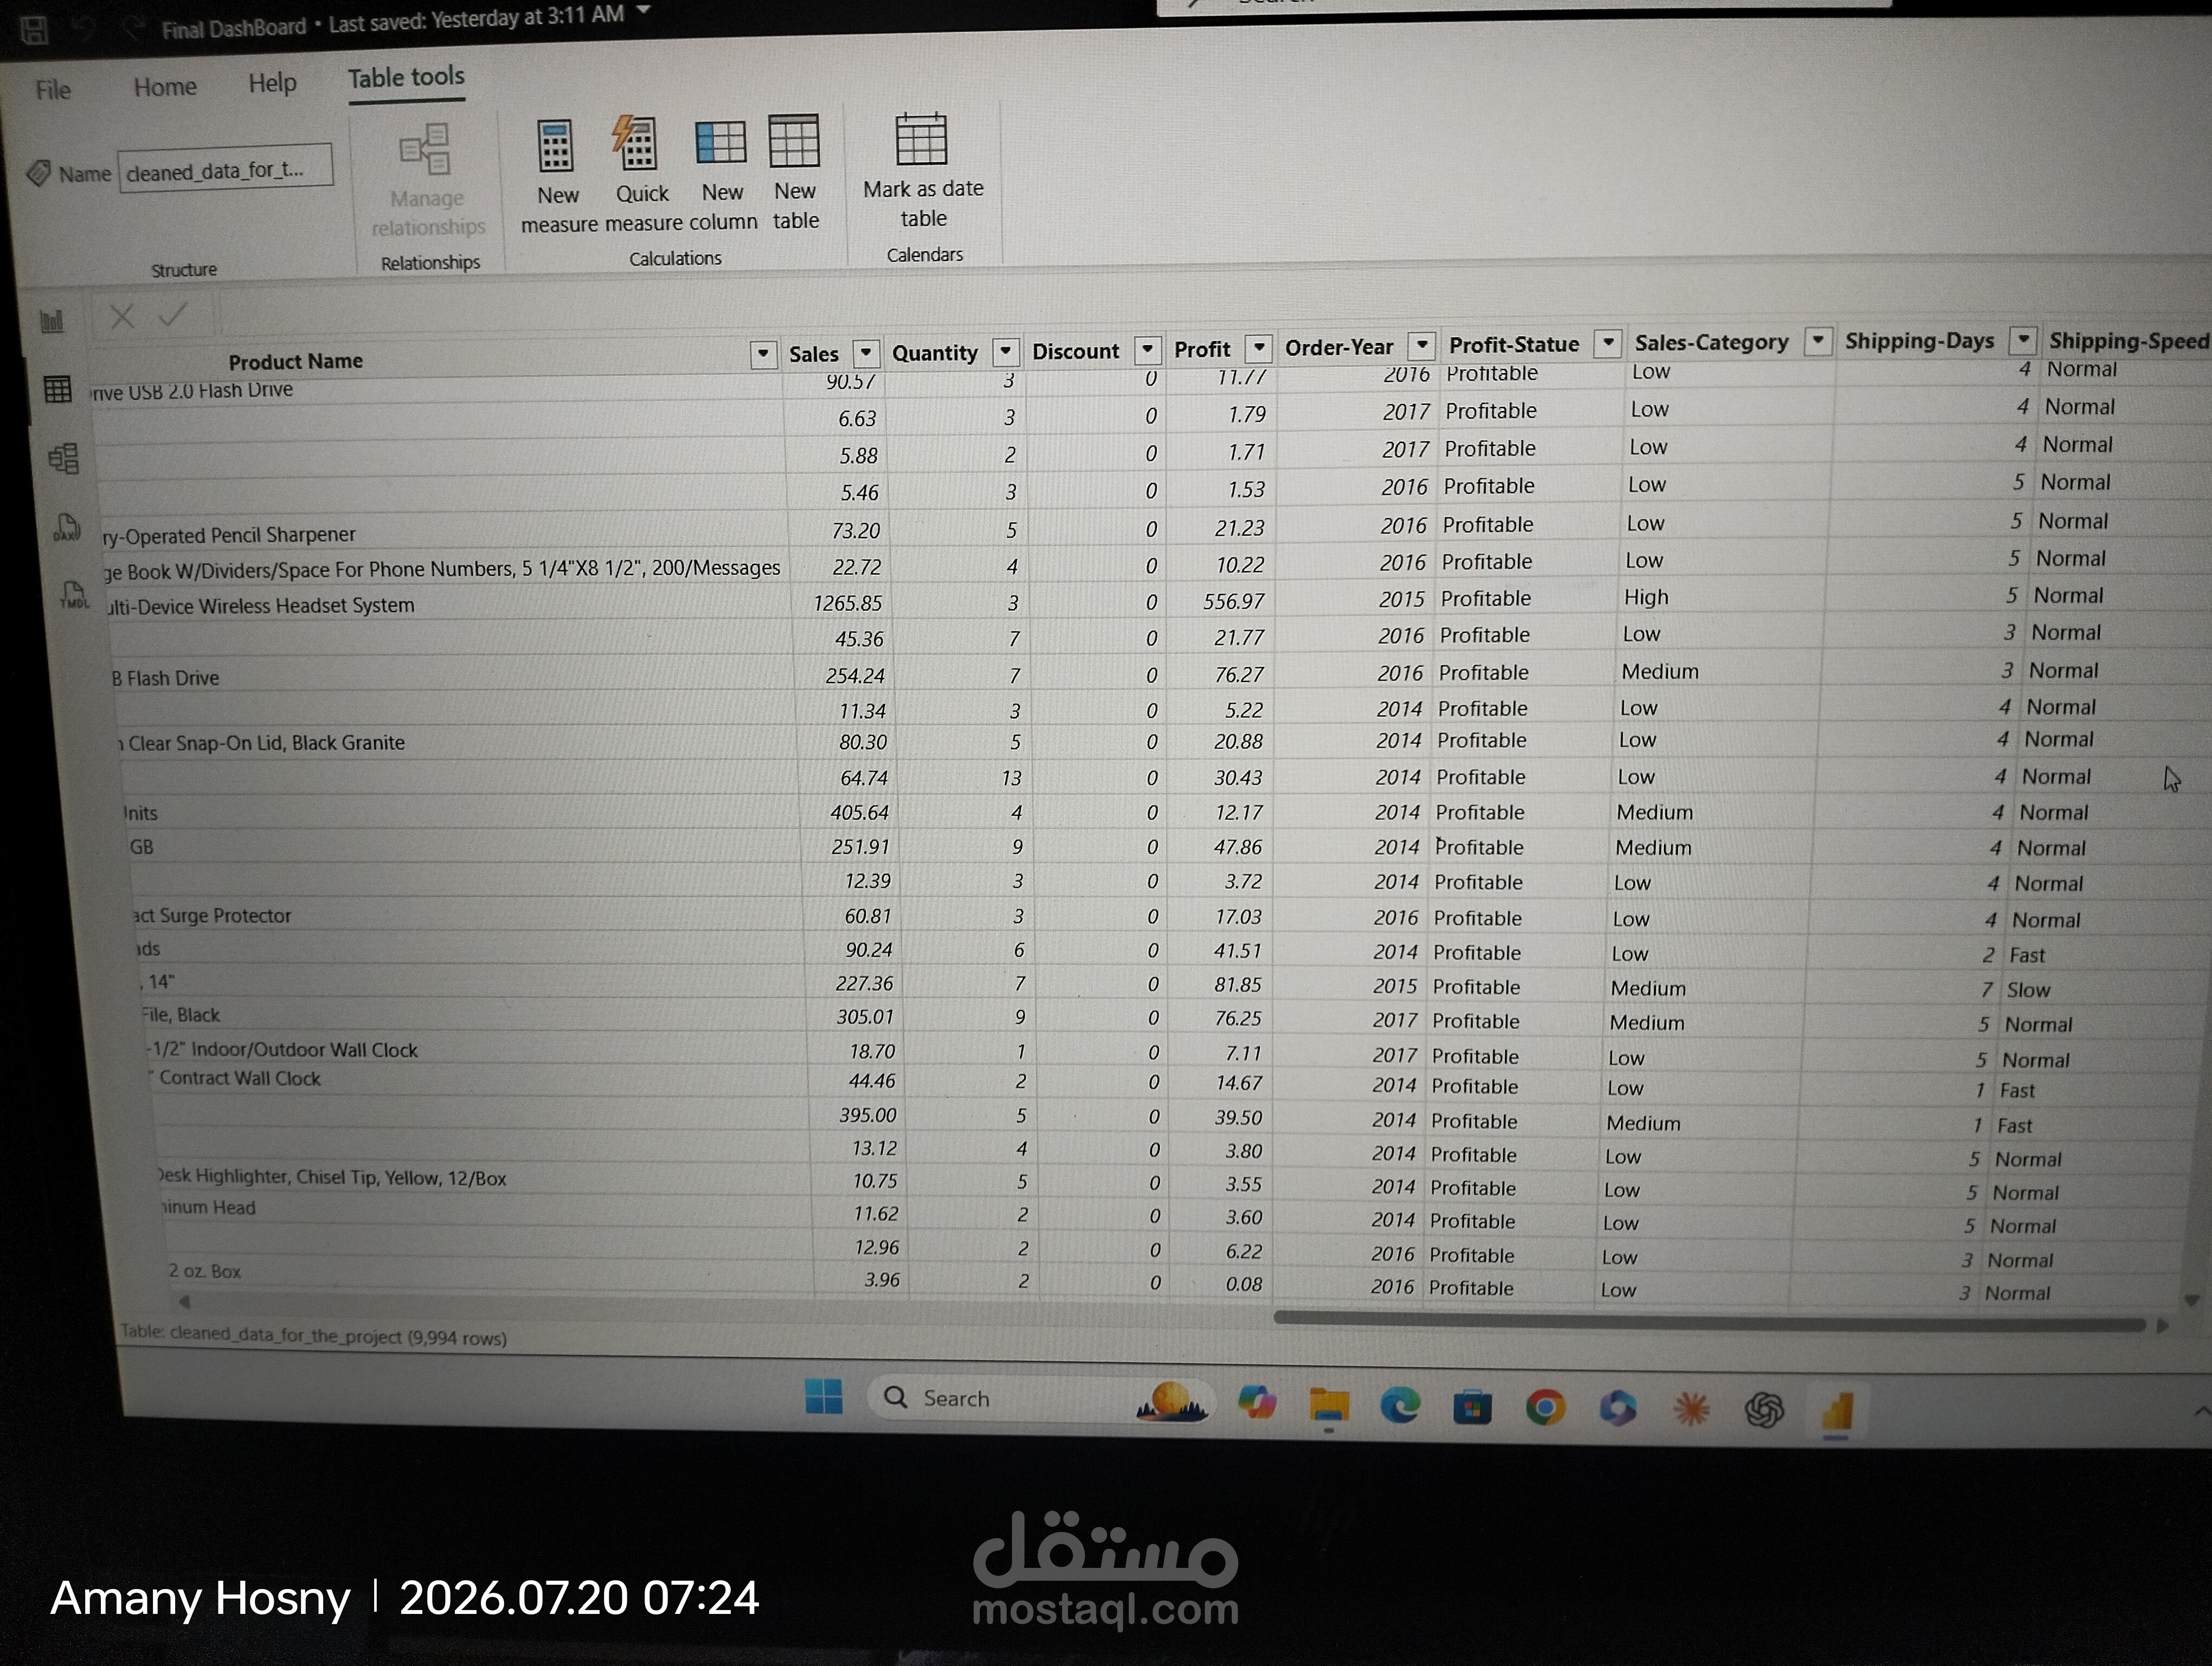
PrimeMart Sales & Profit Performance Dashboard
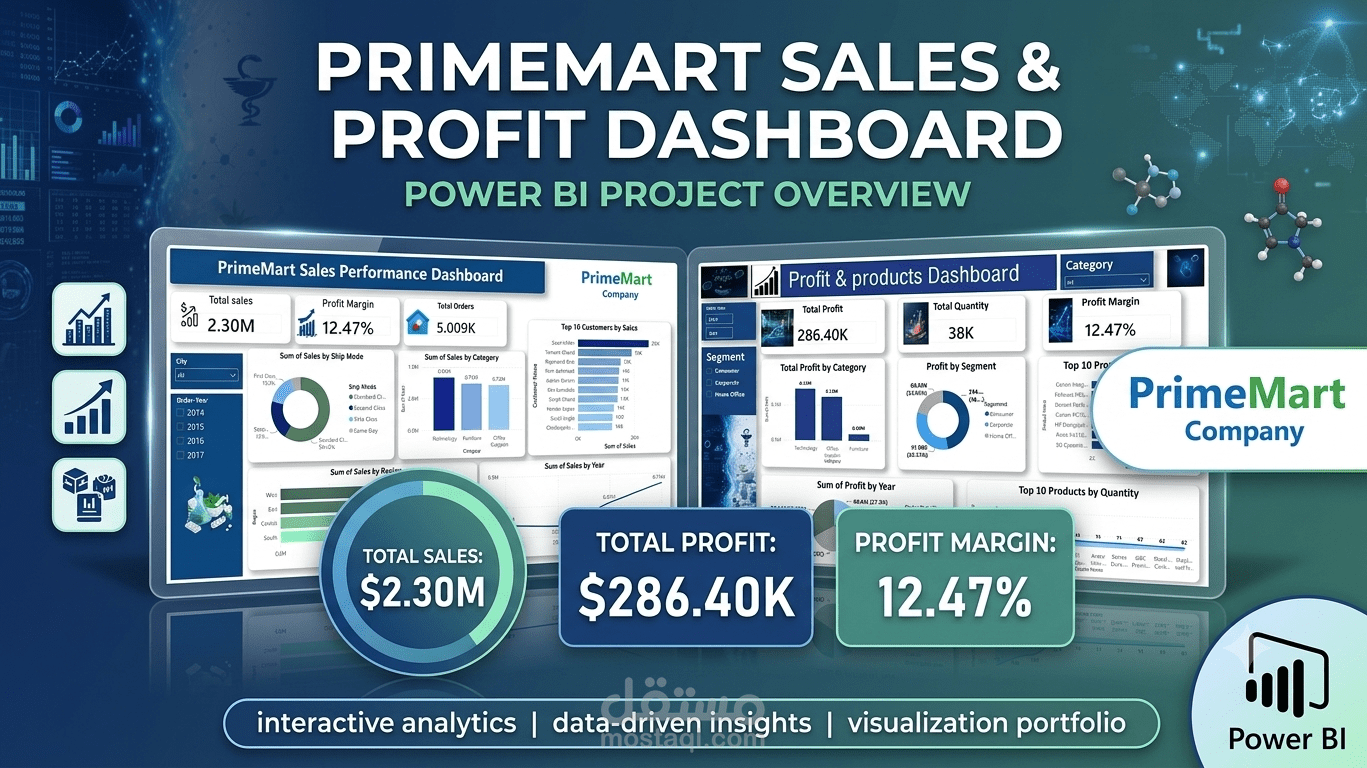
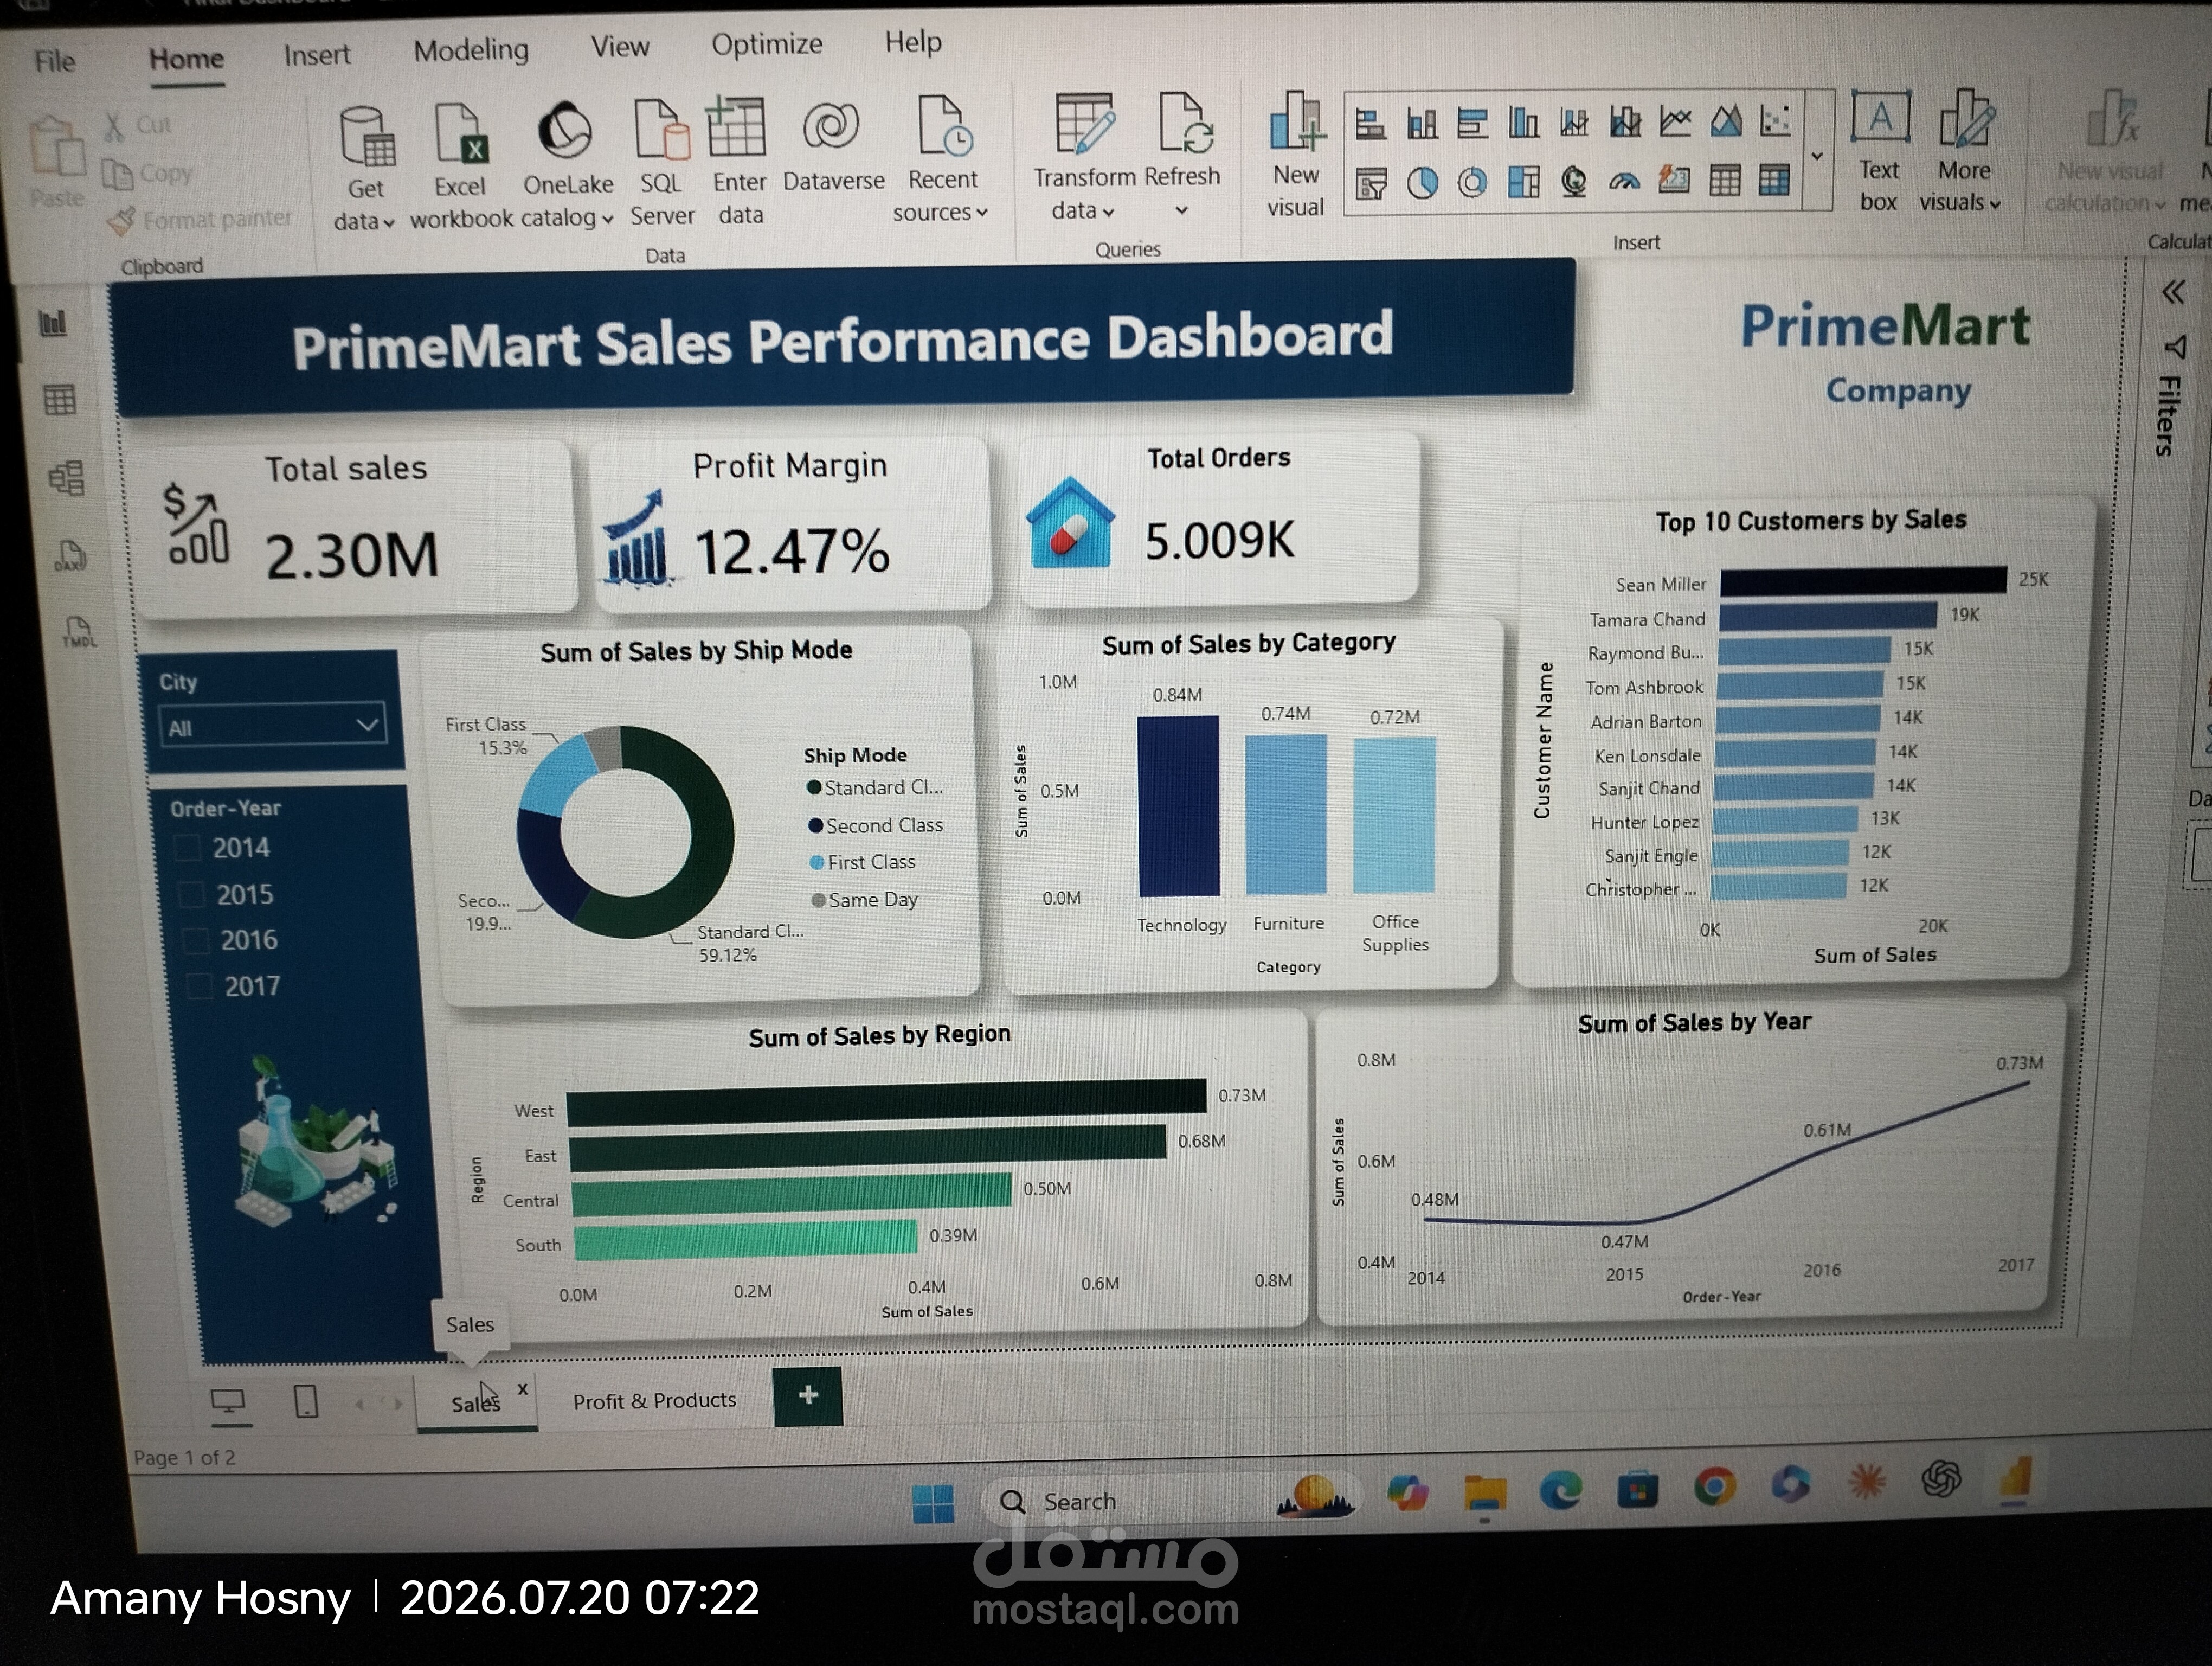
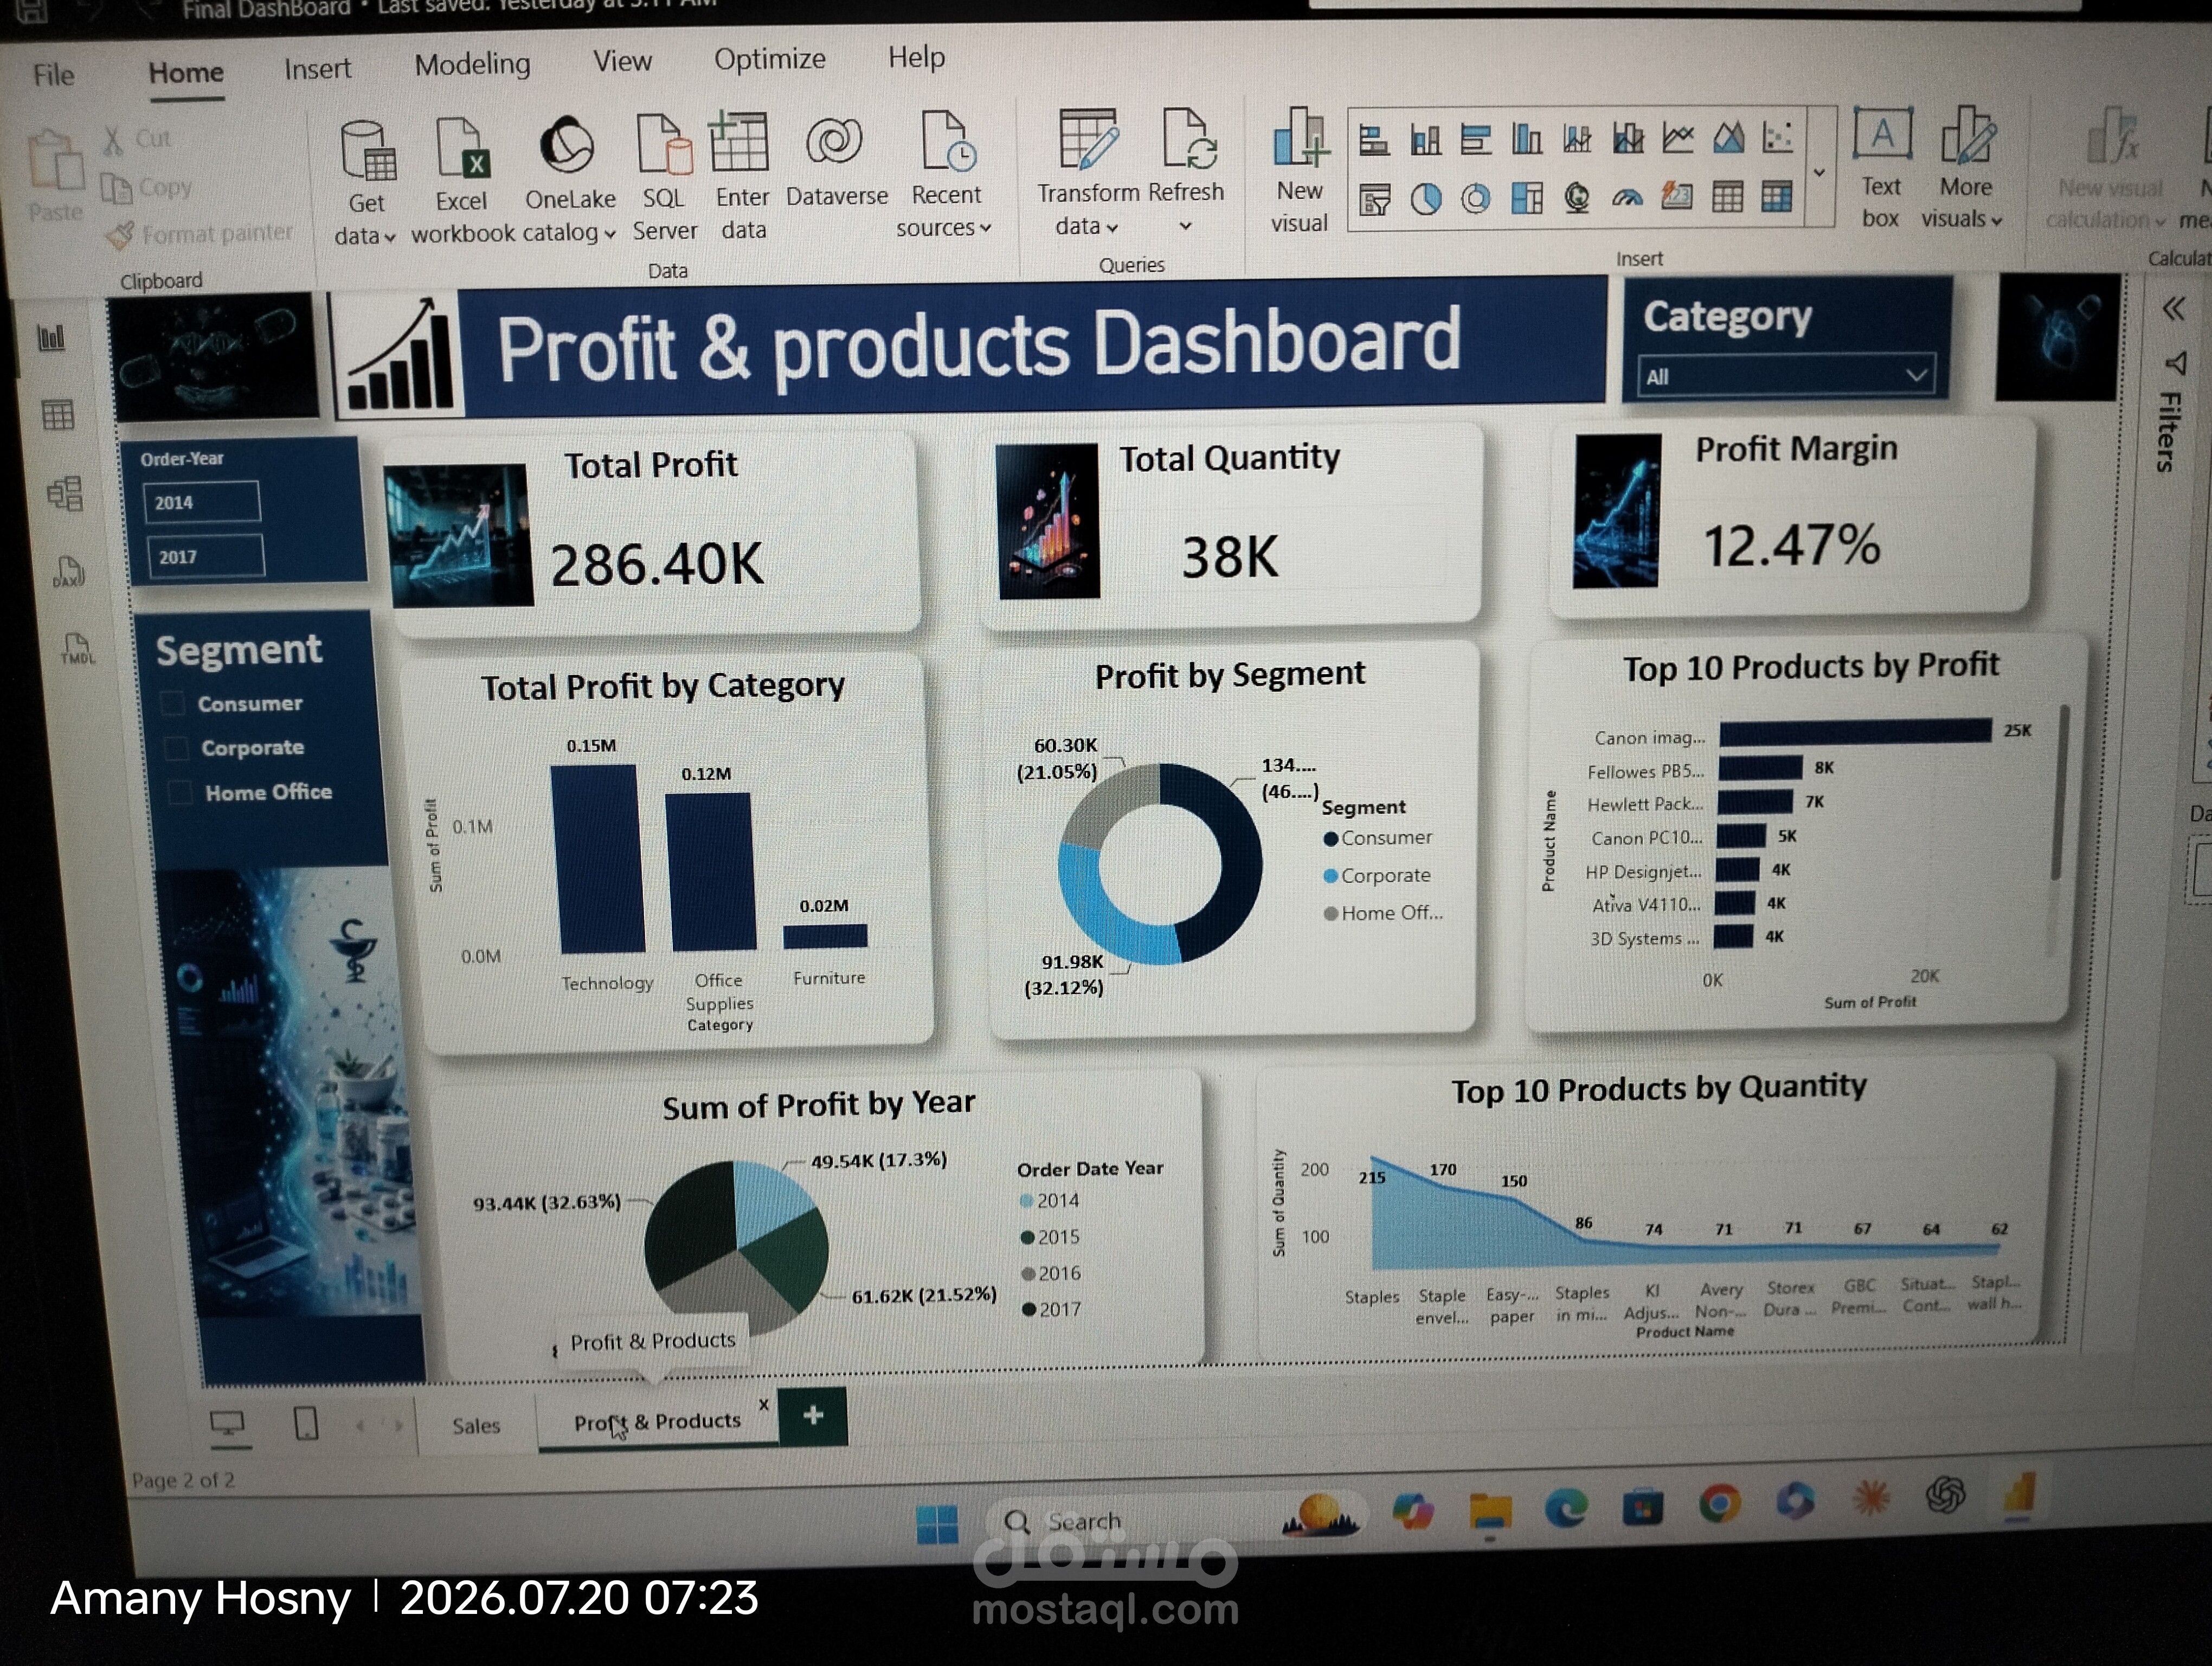
An interactive Power BI dashboard designed to analyze end-to-end business performance, tracking $2.30M in Total Sales and $286K in Total Profit across 4 years (2014–2017).
💡 Key Features & Capabilities:
Sales Overview: Tracks yearly revenue growth, top customers, regional performance, and shipping mode preferences.
Profit & Product Analysis: Highlights top-performing product categories, customer segment profitability, and quantity sold.
Interactive Filtering: Dynamic slicers by year, region, category, and customer segment for deep-dive analysis.
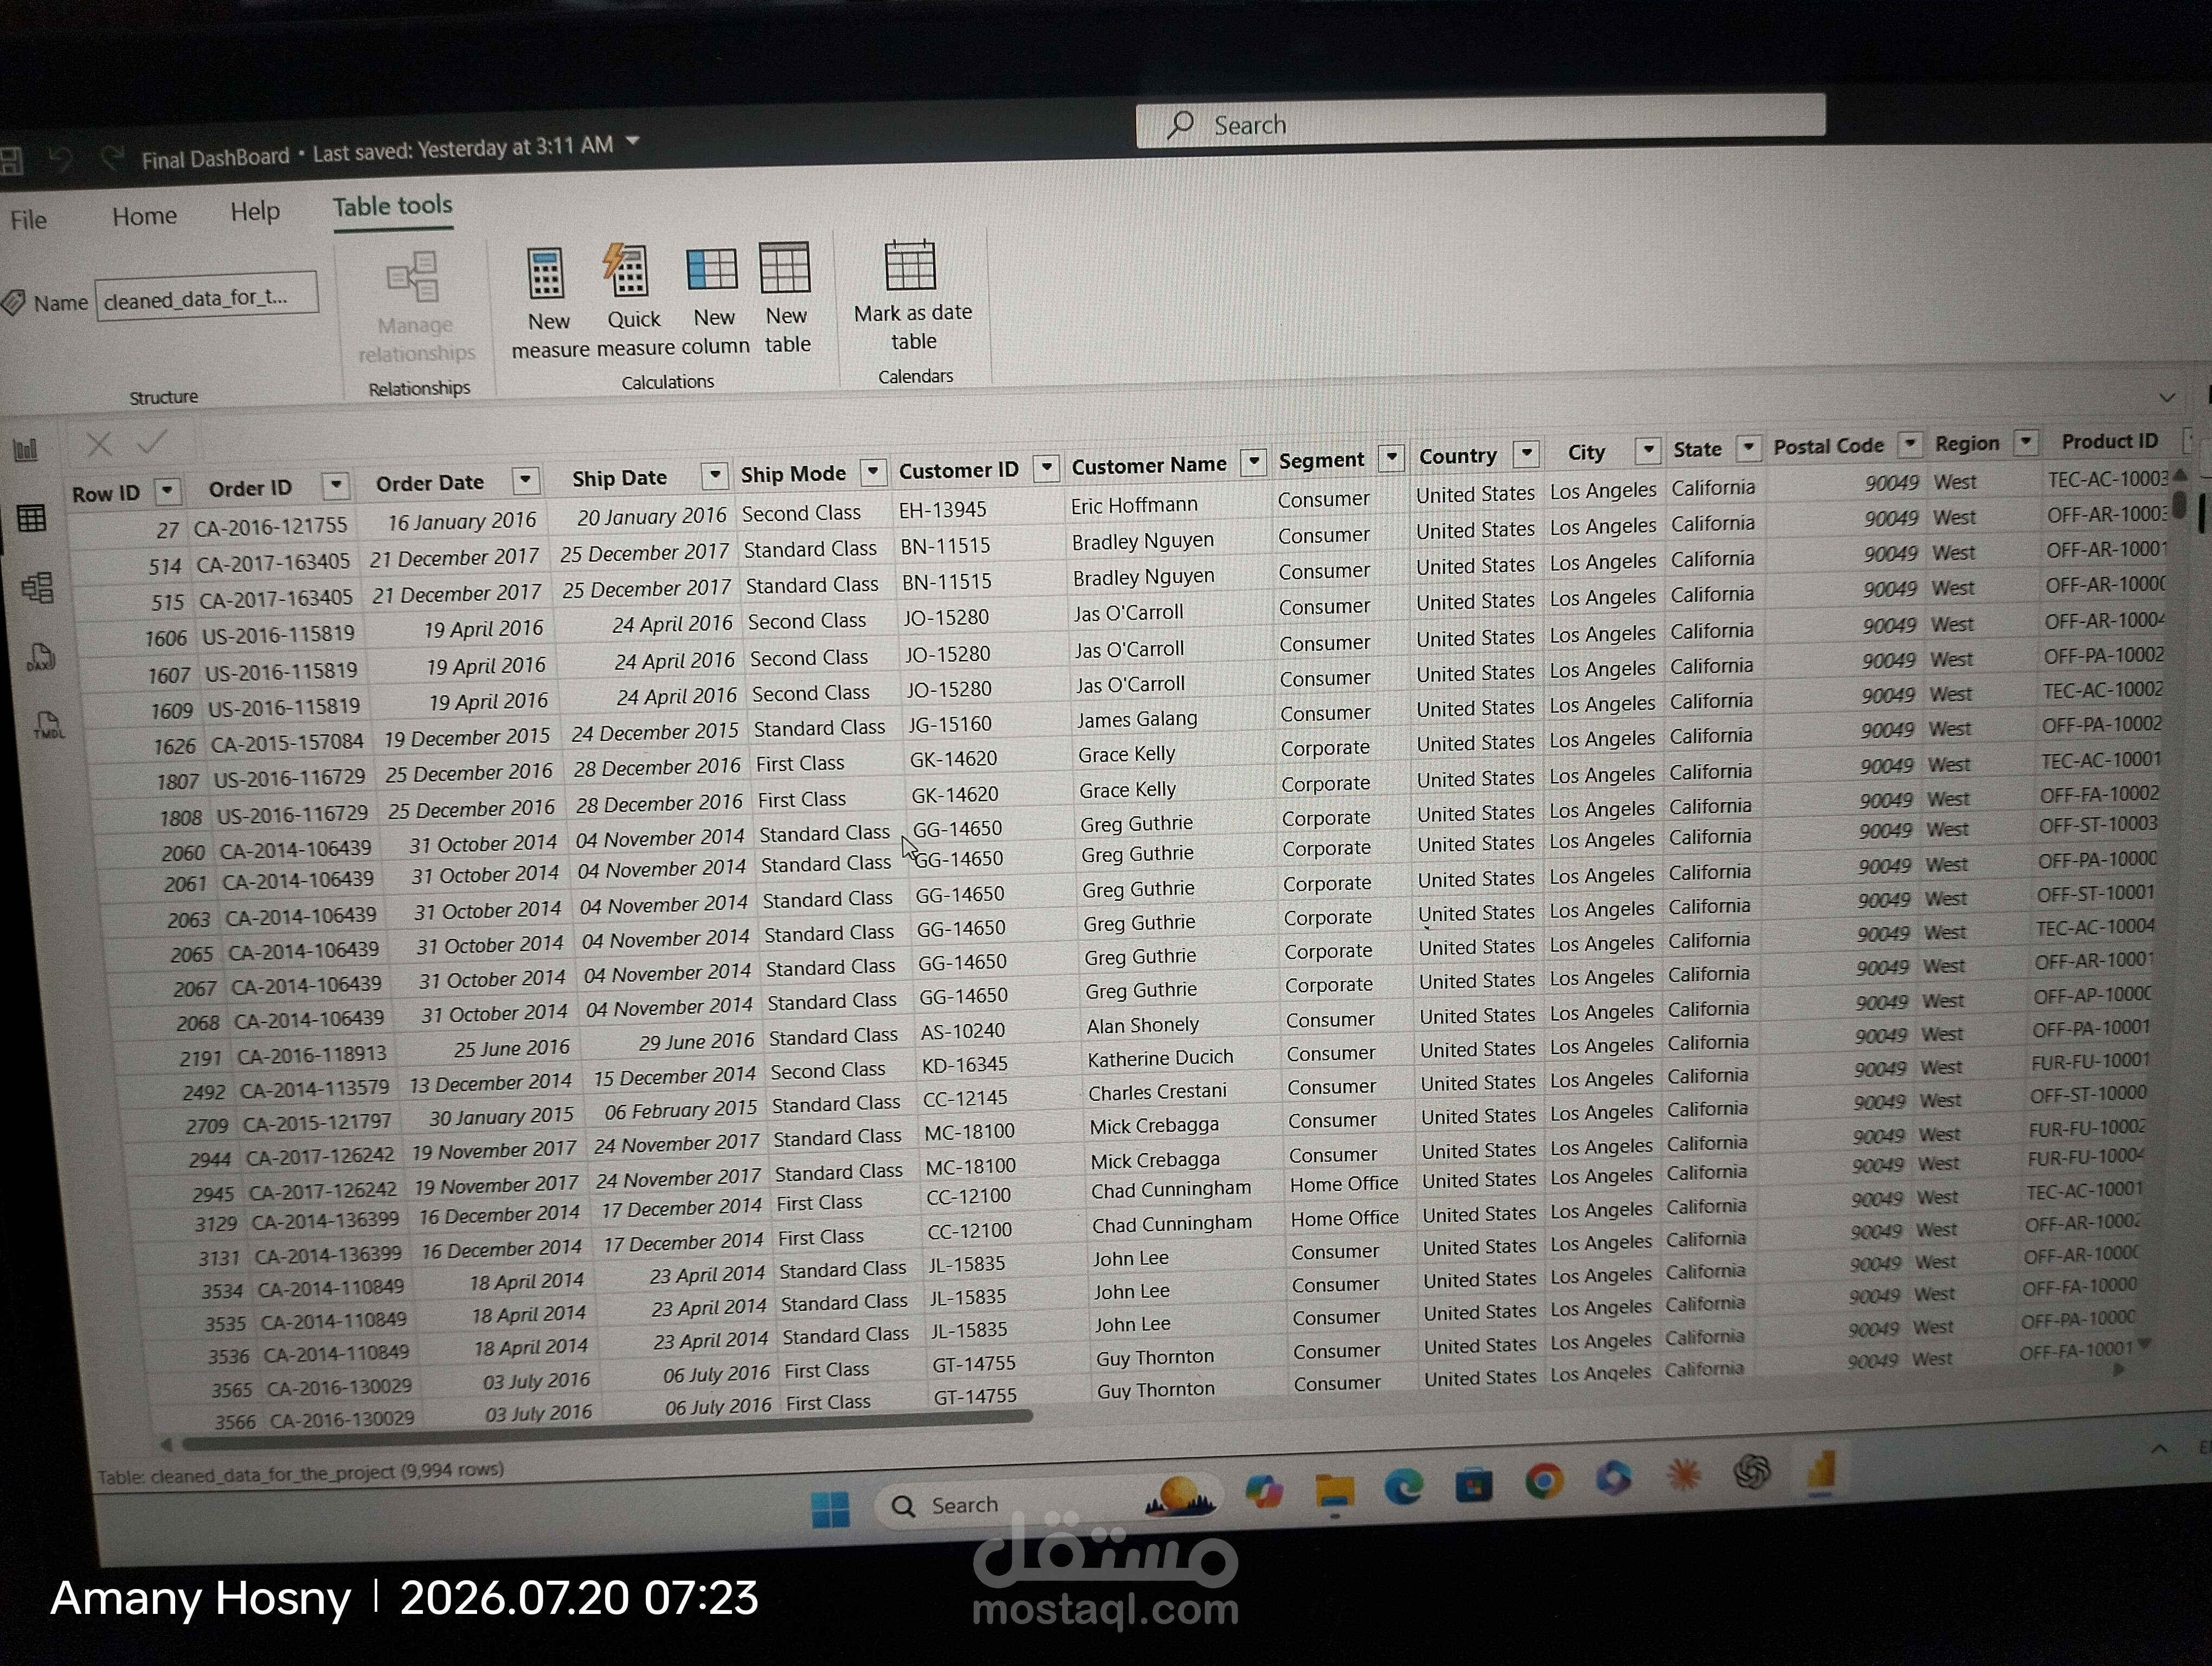
Tools Used: Power BI | Data Modeling | DAX | Interactive UI/UX Design
#PowerBI #DataAnalytics #DataVisualization #Dashboard #SalesAnalytics #Portfolio