Sales Dashboard
تفاصيل العمل
Power BI Sales Dashboard Project | Simbel Store
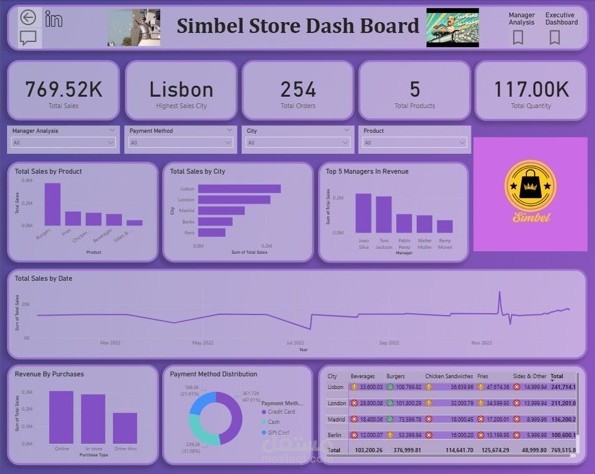
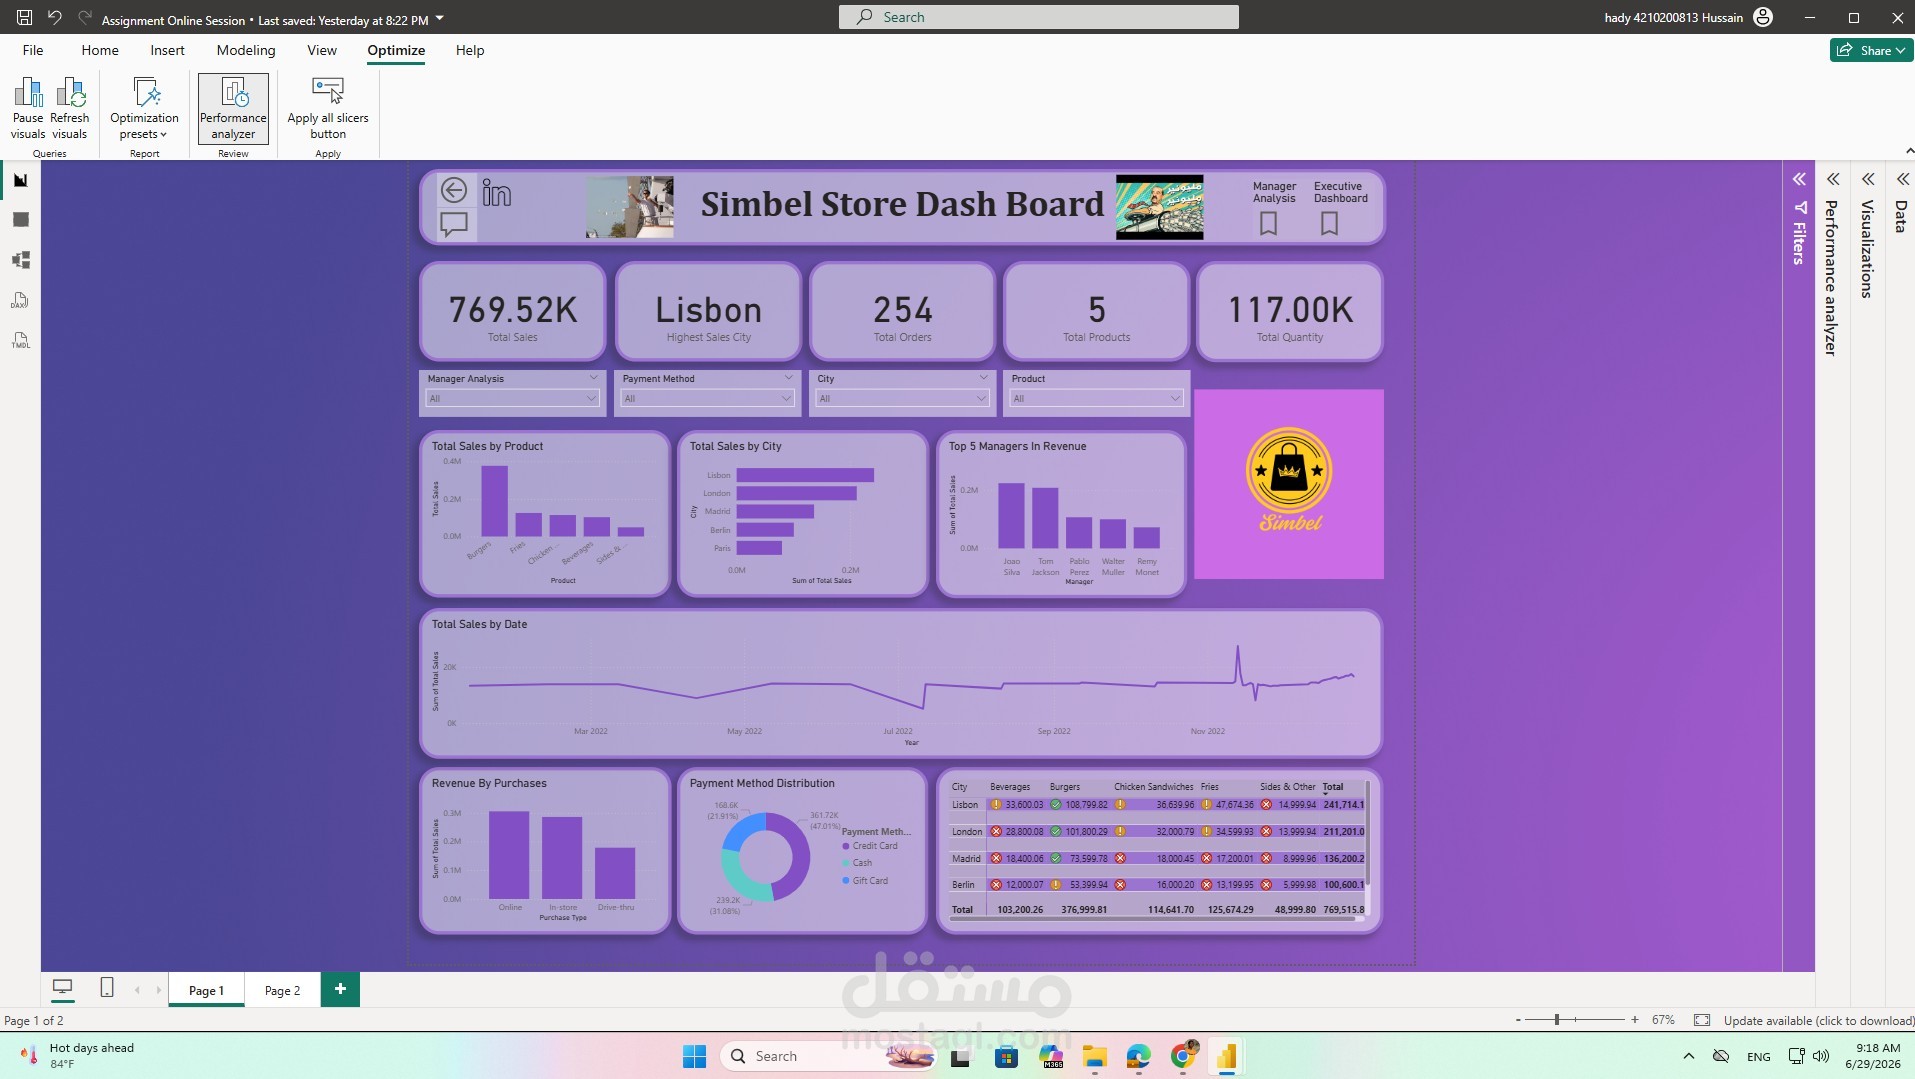
Excited to share one of my latest Power BI projects—a fully interactive Sales Dashboard designed to provide clear and actionable business insights.
Through this dashboard, decision-makers can easily monitor sales performance, analyze customer purchasing behavior, and identify key business trends in real time.
Key Features:
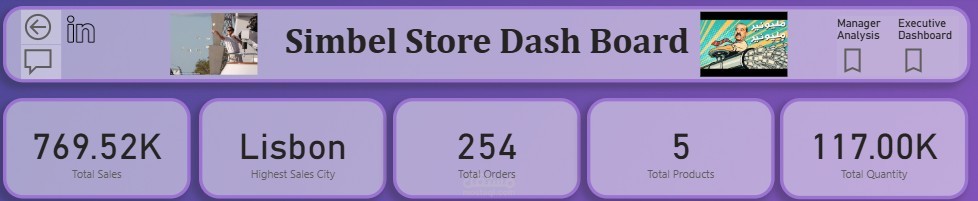
Total Sales, Orders, Products, and Quantity KPIs.
Highest performing city analysis.
Sales trends over time.
Revenue breakdown by purchase channel.
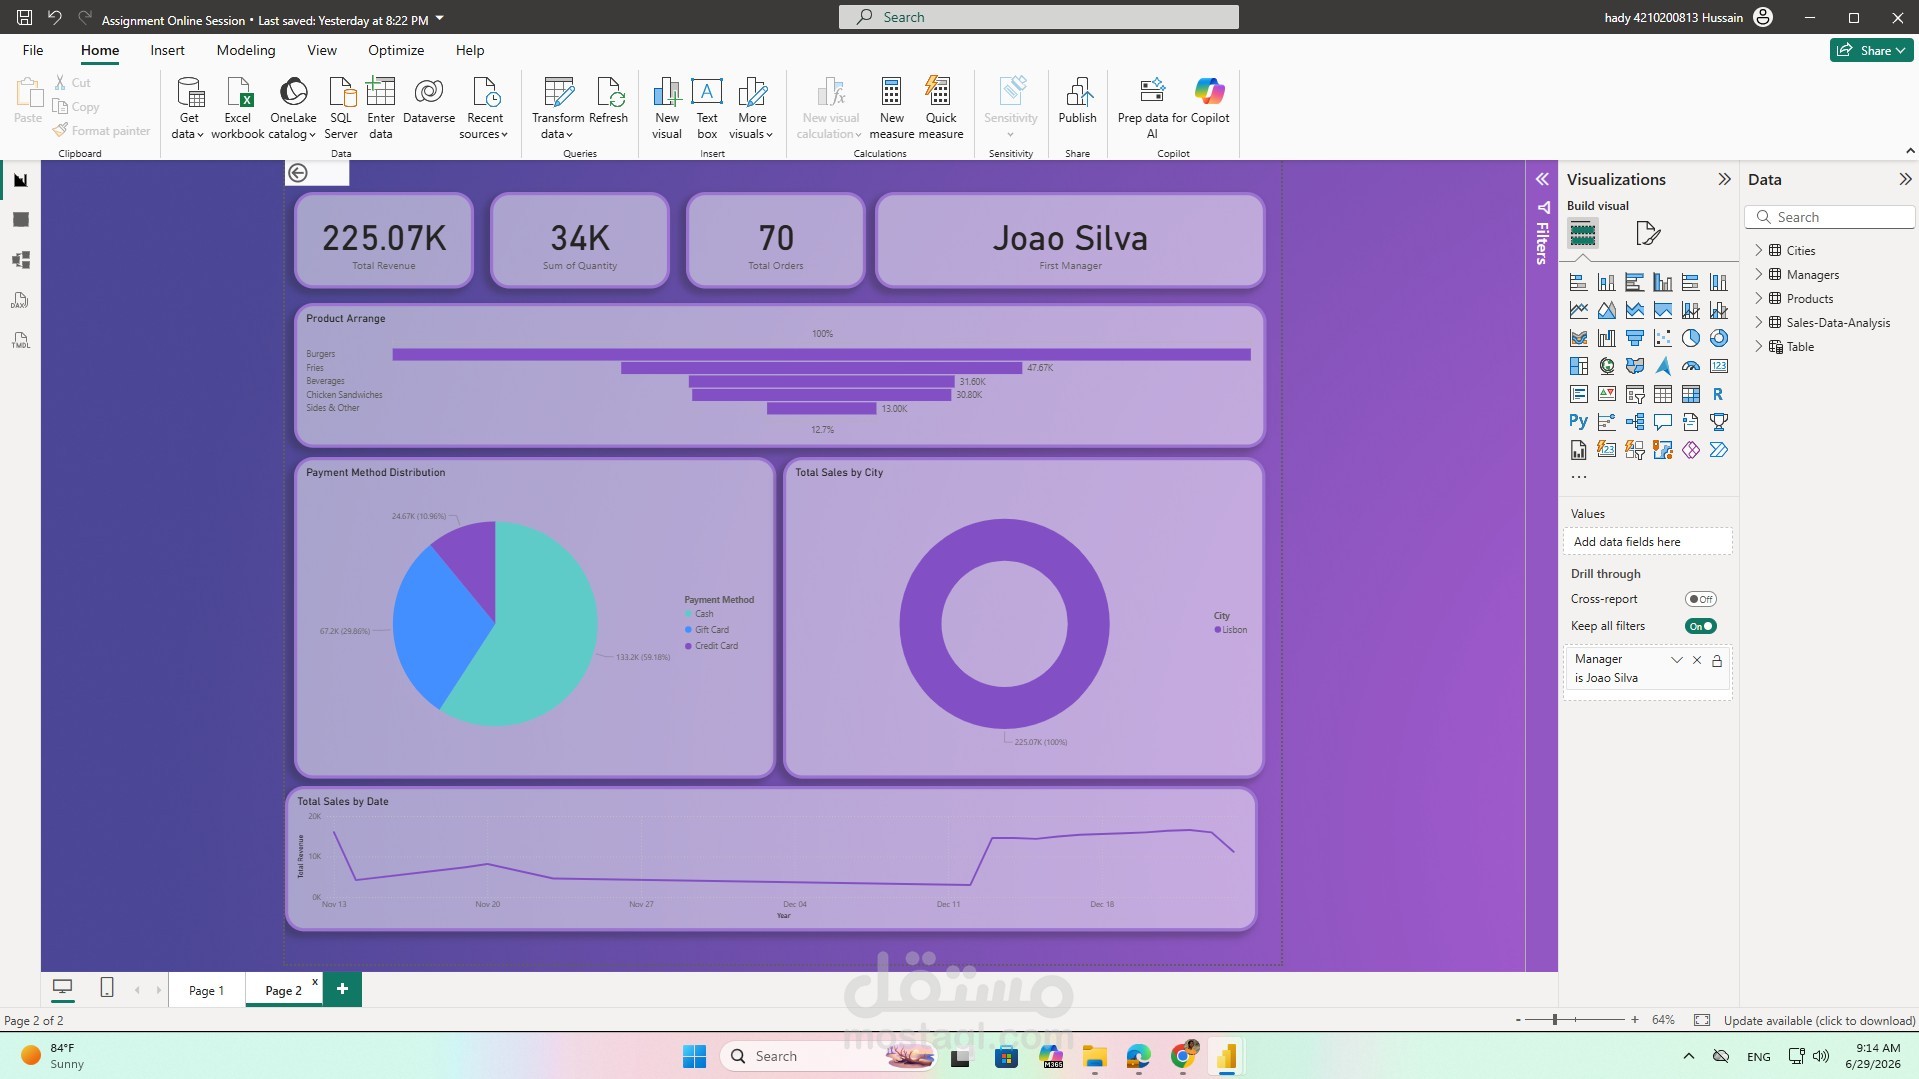
Payment method distribution analysis.
Product performance comparison.
Top-performing managers by revenue.
Interactive filters for dynamic data exploration.
Tools & Skills Used:
Power BI
Power Query
DAX
Data Cleaning & Transformation
Data Modeling
Data Visualization
Business Questions Answered:
Which city generates the highest sales?
What are the best-selling products?
Which payment methods are preferred by customers?
Which purchase channels generate the most revenue?
How does sales performance change over time?
This project helped me practice transforming raw data into meaningful insights that support business decisions and improve performance tracking.
I'm continuously working on building real-world data analytics projects to strengthen my portfolio and expand my analytical skills.