E-Learning Customer Engagement Dashboard | لوحة تحليل تفاعل الطلاب
تفاصيل العمل

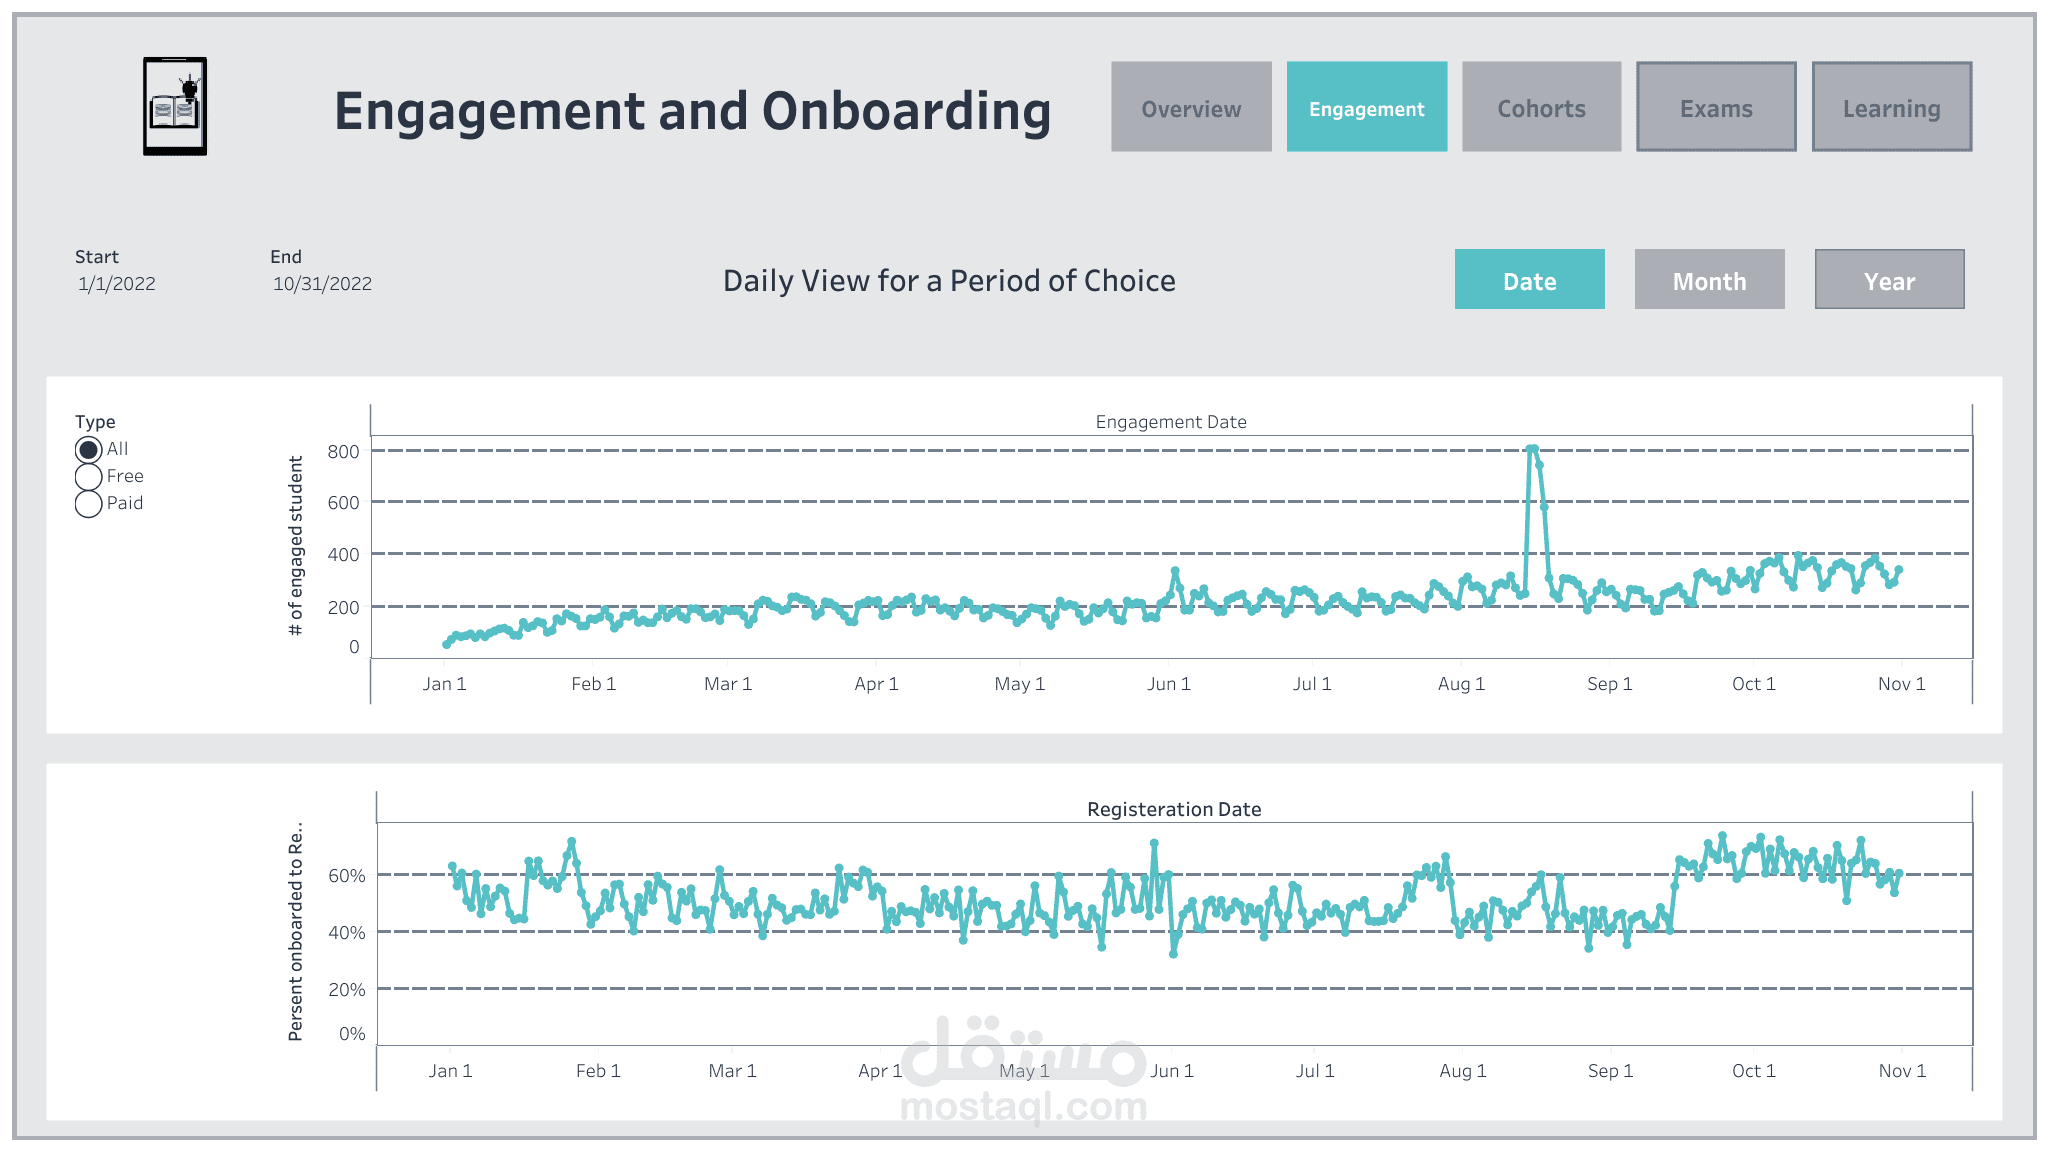
🎓 E-Learning Customer Engagement Dashboard | لوحة تحليل تفاعل الطلاب
لوحة تفاعلية من 5 صفحات على Tableau لمنصة تعليم إلكتروني — تحلّل تفاعل الطلاب، الاحتفاظ بهم (Retention)، ومعدلات الإتمام والتحويل.
━━━━━━━━━━━━━━━━━━
🎯 الهدف | Purpose
Help the product & content team understand how students engage, where they stay, and where they drop off.
📊 أهم المؤشرات | Key Metrics
👨🎓 Engaged Students: 19,332
⏱️ Minutes per Student: 81.4
📜 Certificates Issued: 3,683
⭐ Average Rating: 4.79 / 5
🗂️ الصفحات | The 5 Views
1️⃣ Overview — headline engagement KPIs & top courses by minutes watched
2️⃣ Engagement — deeper activity breakdowns
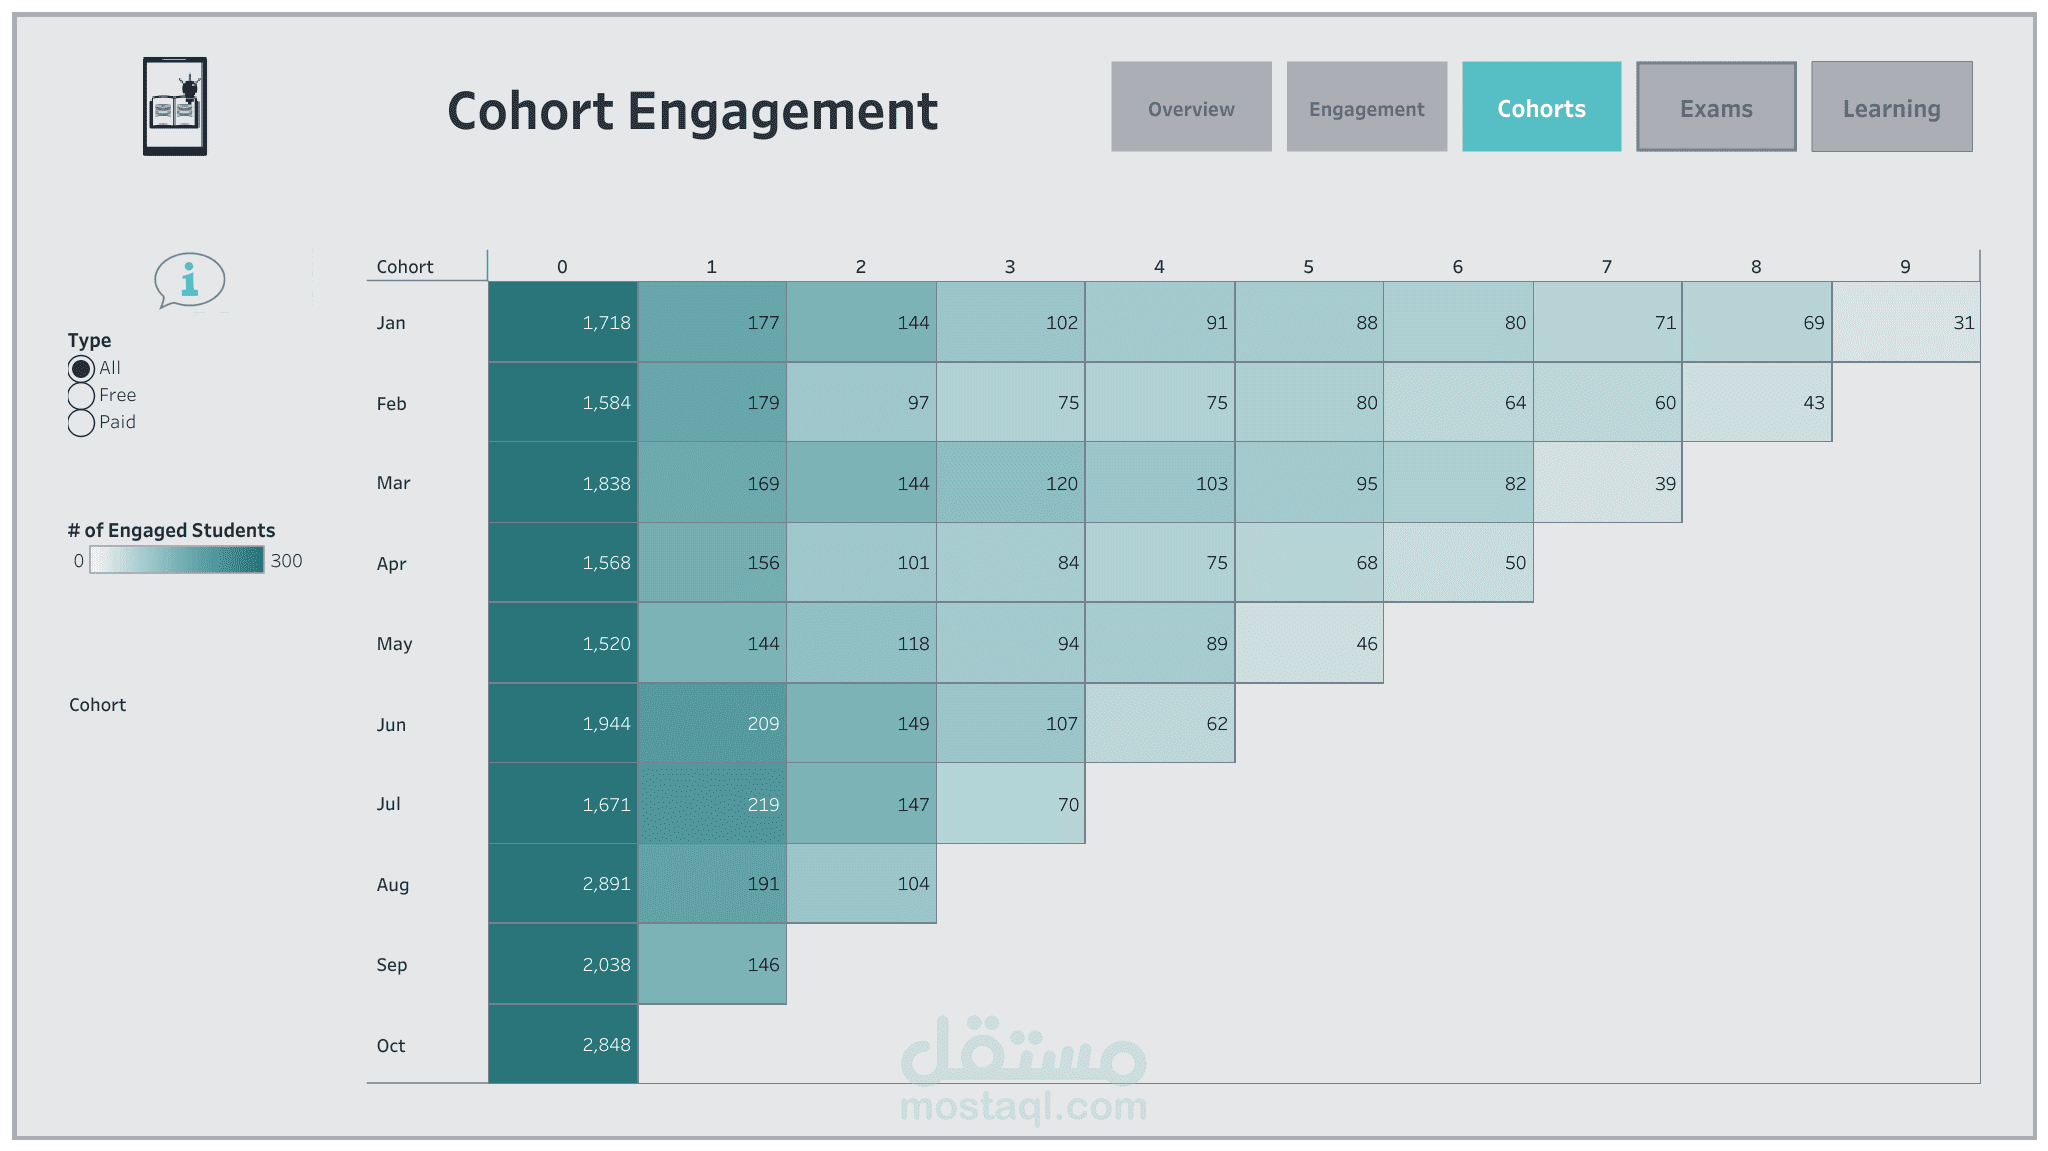
3️⃣ Cohort Engagement — a retention-triangle heatmap
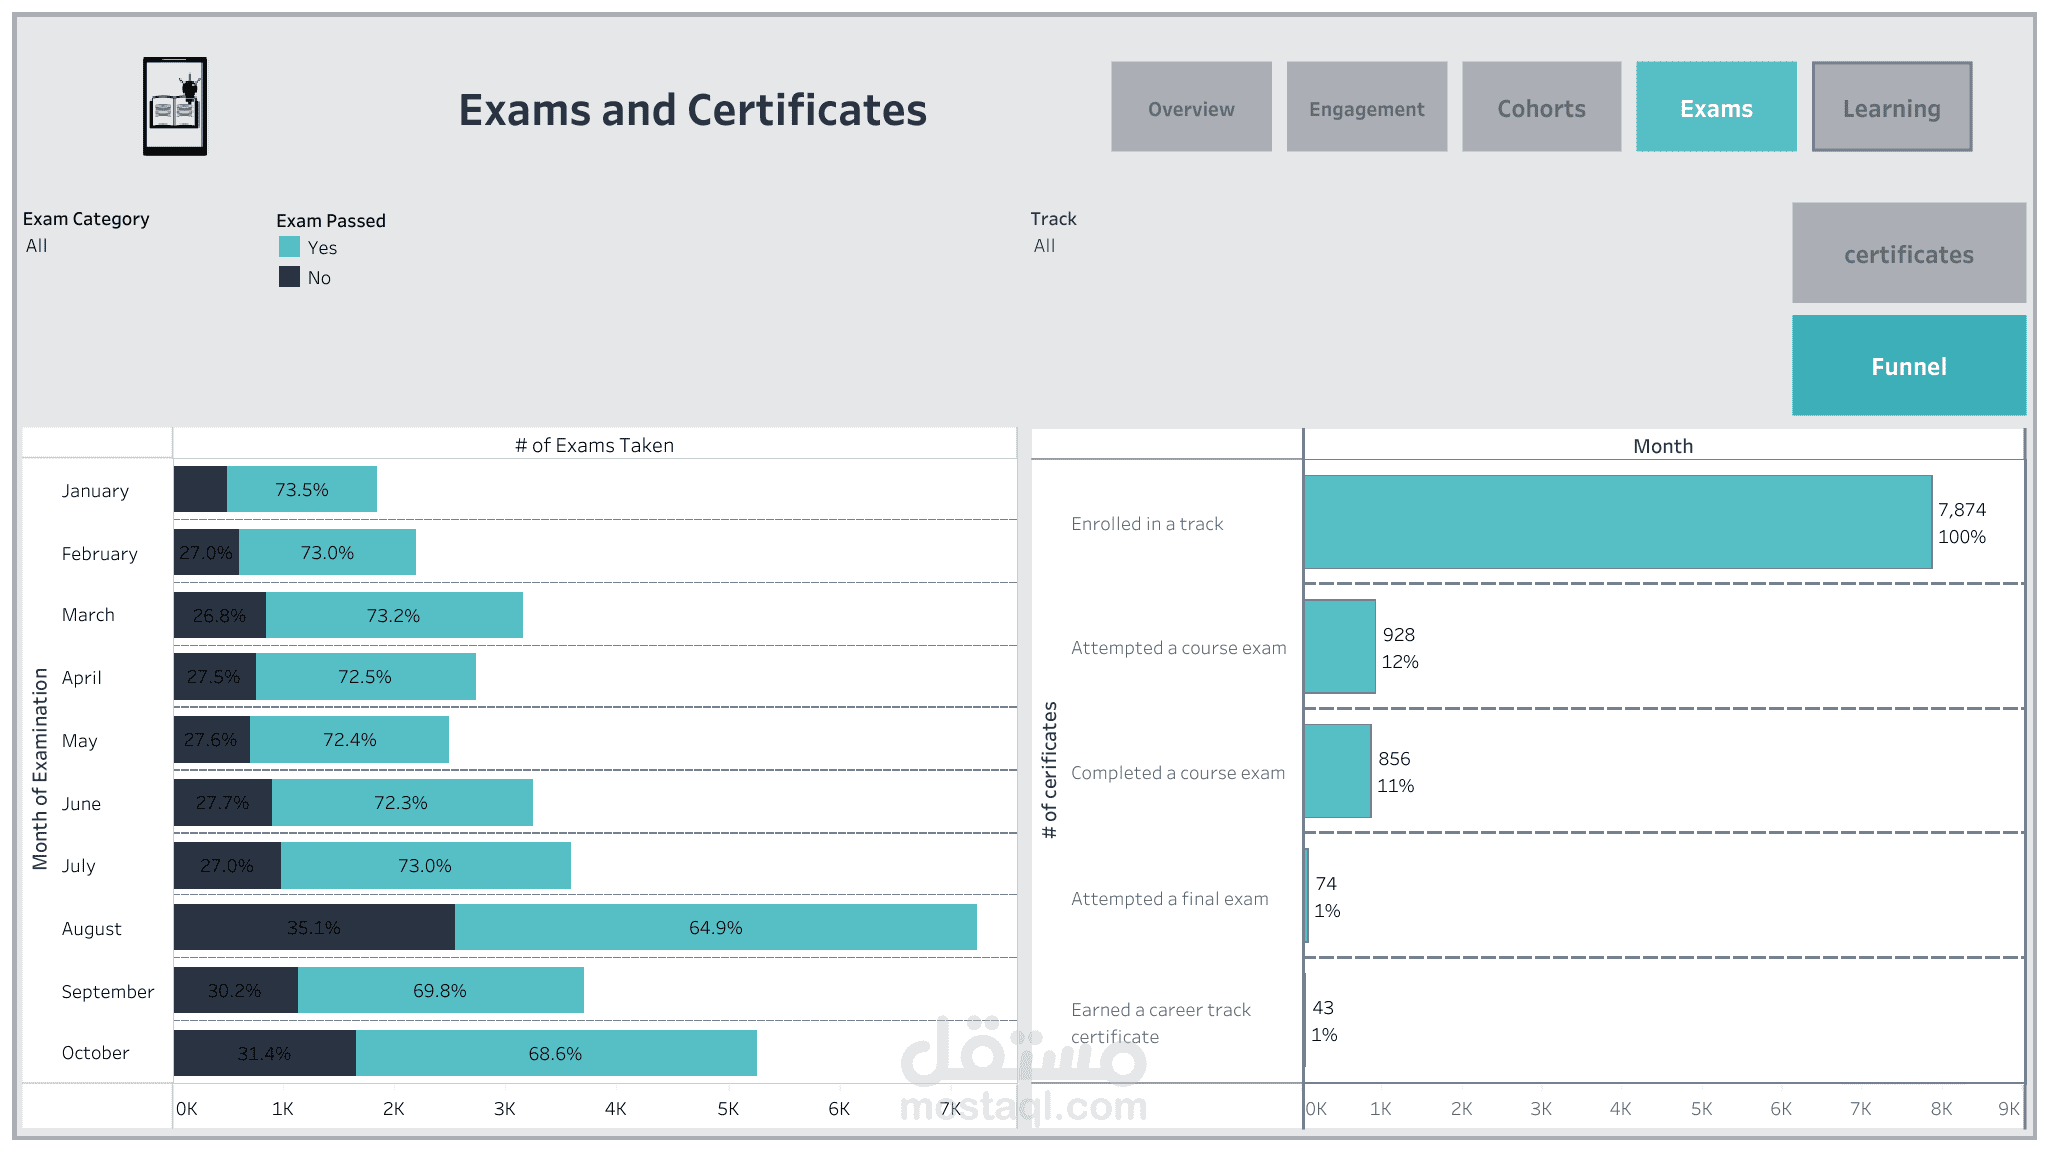
4️⃣ Exams & Funnel — completion and conversion steps
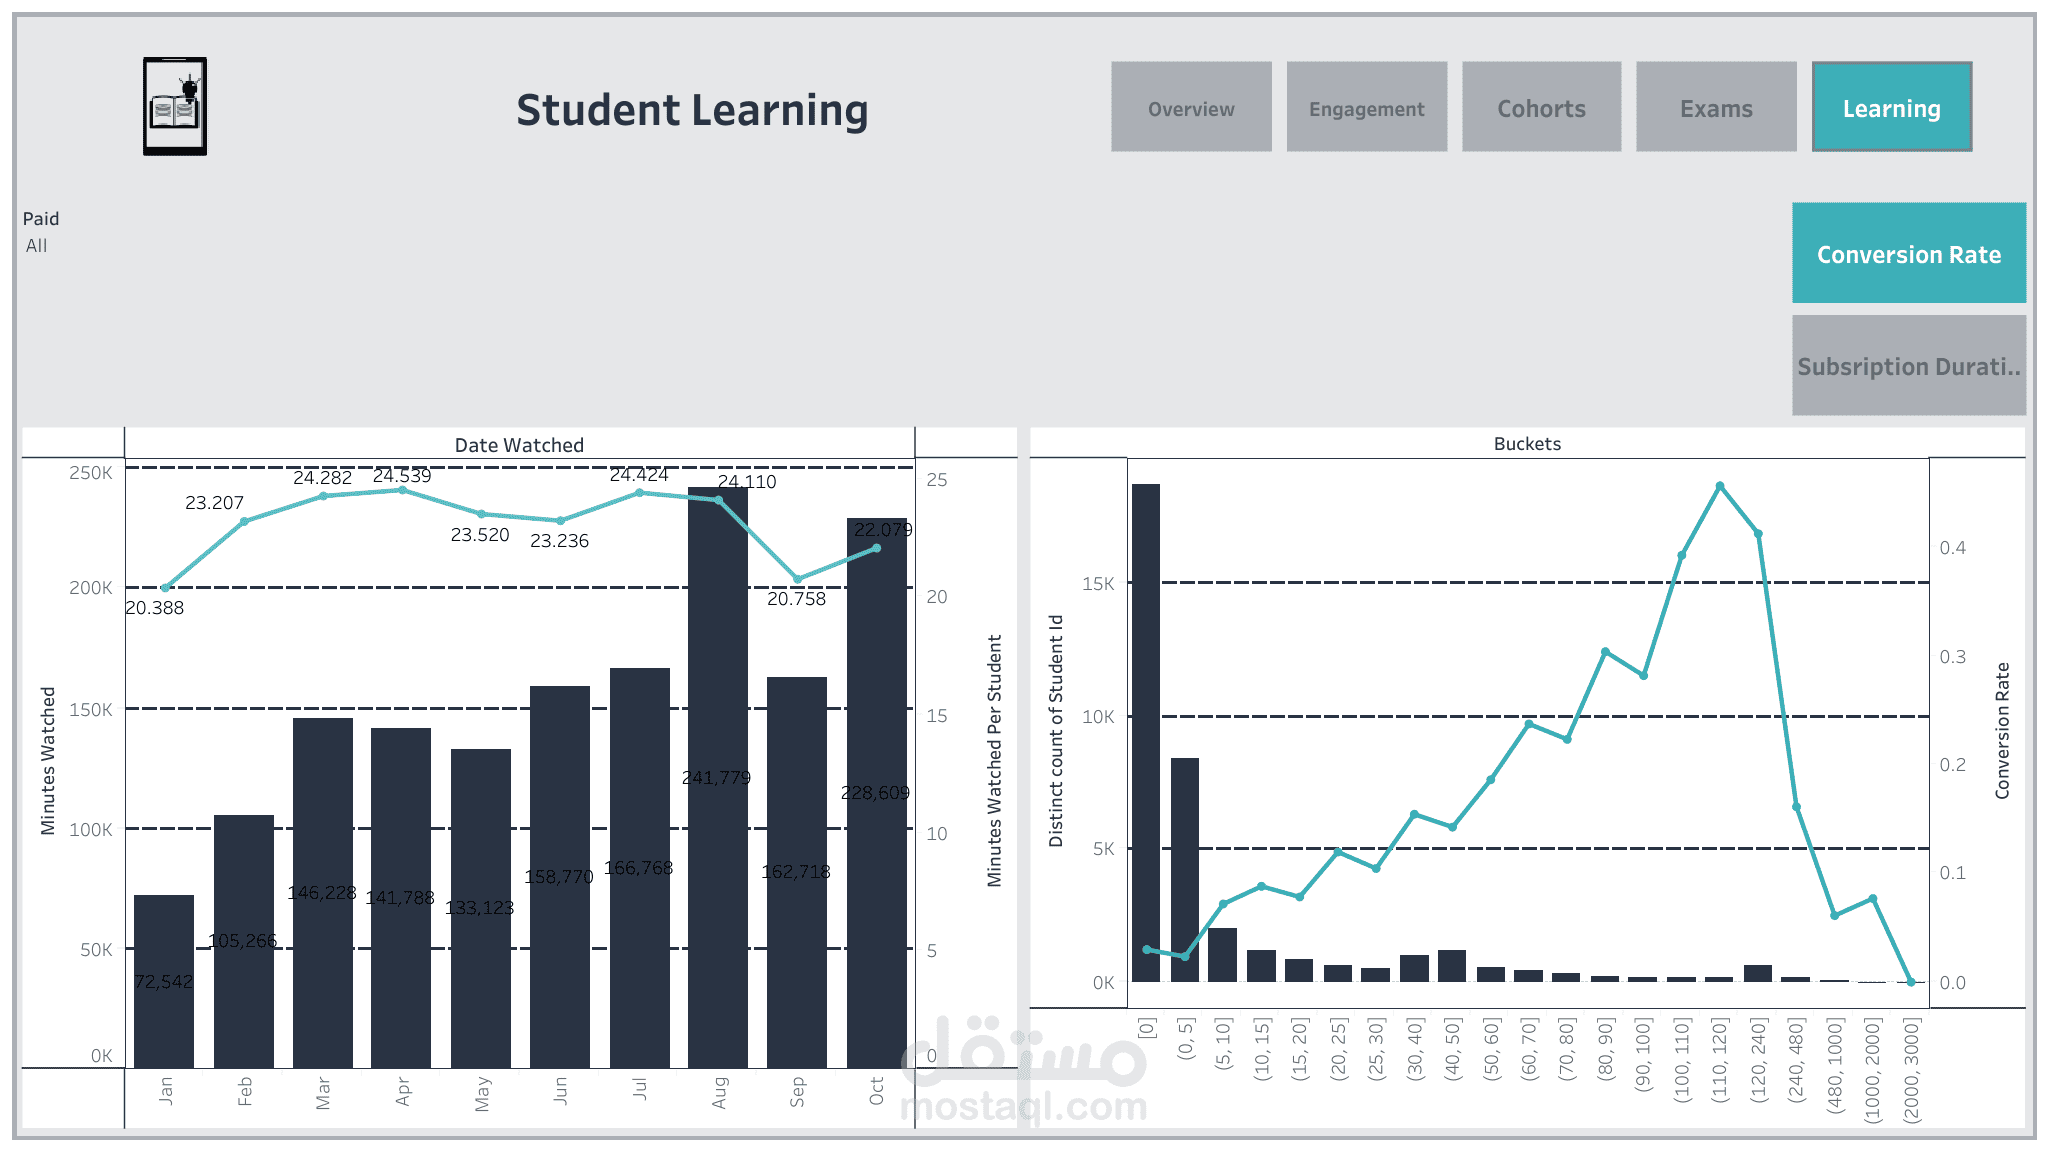
5️⃣ Learning & Conversion Rate
🛠️ التفاعل | Interactivity
▫️ Parameter-driven metric switching
▫️ Top / bottom filters
▫️ Cohort retention analysis
💡 أهم الاستنتاجات | Key Takeaways
✅ Cohort heatmap reveals exactly when students disengage
✅ Top-courses view shows what content holds attention longest
✅ Funnel pinpoints where learners drop before completing
🧰 الأدوات | Tools & Techniques
Tableau • Cohort retention heatmap • Funnel analysis • LOD calculations • Parameters • Dashboard actions