Call Centre Performance Dashboard | لوحة أداء مركز الاتصال
تفاصيل العمل
📞 Call Centre Performance Dashboard | لوحة أداء مركز الاتصال
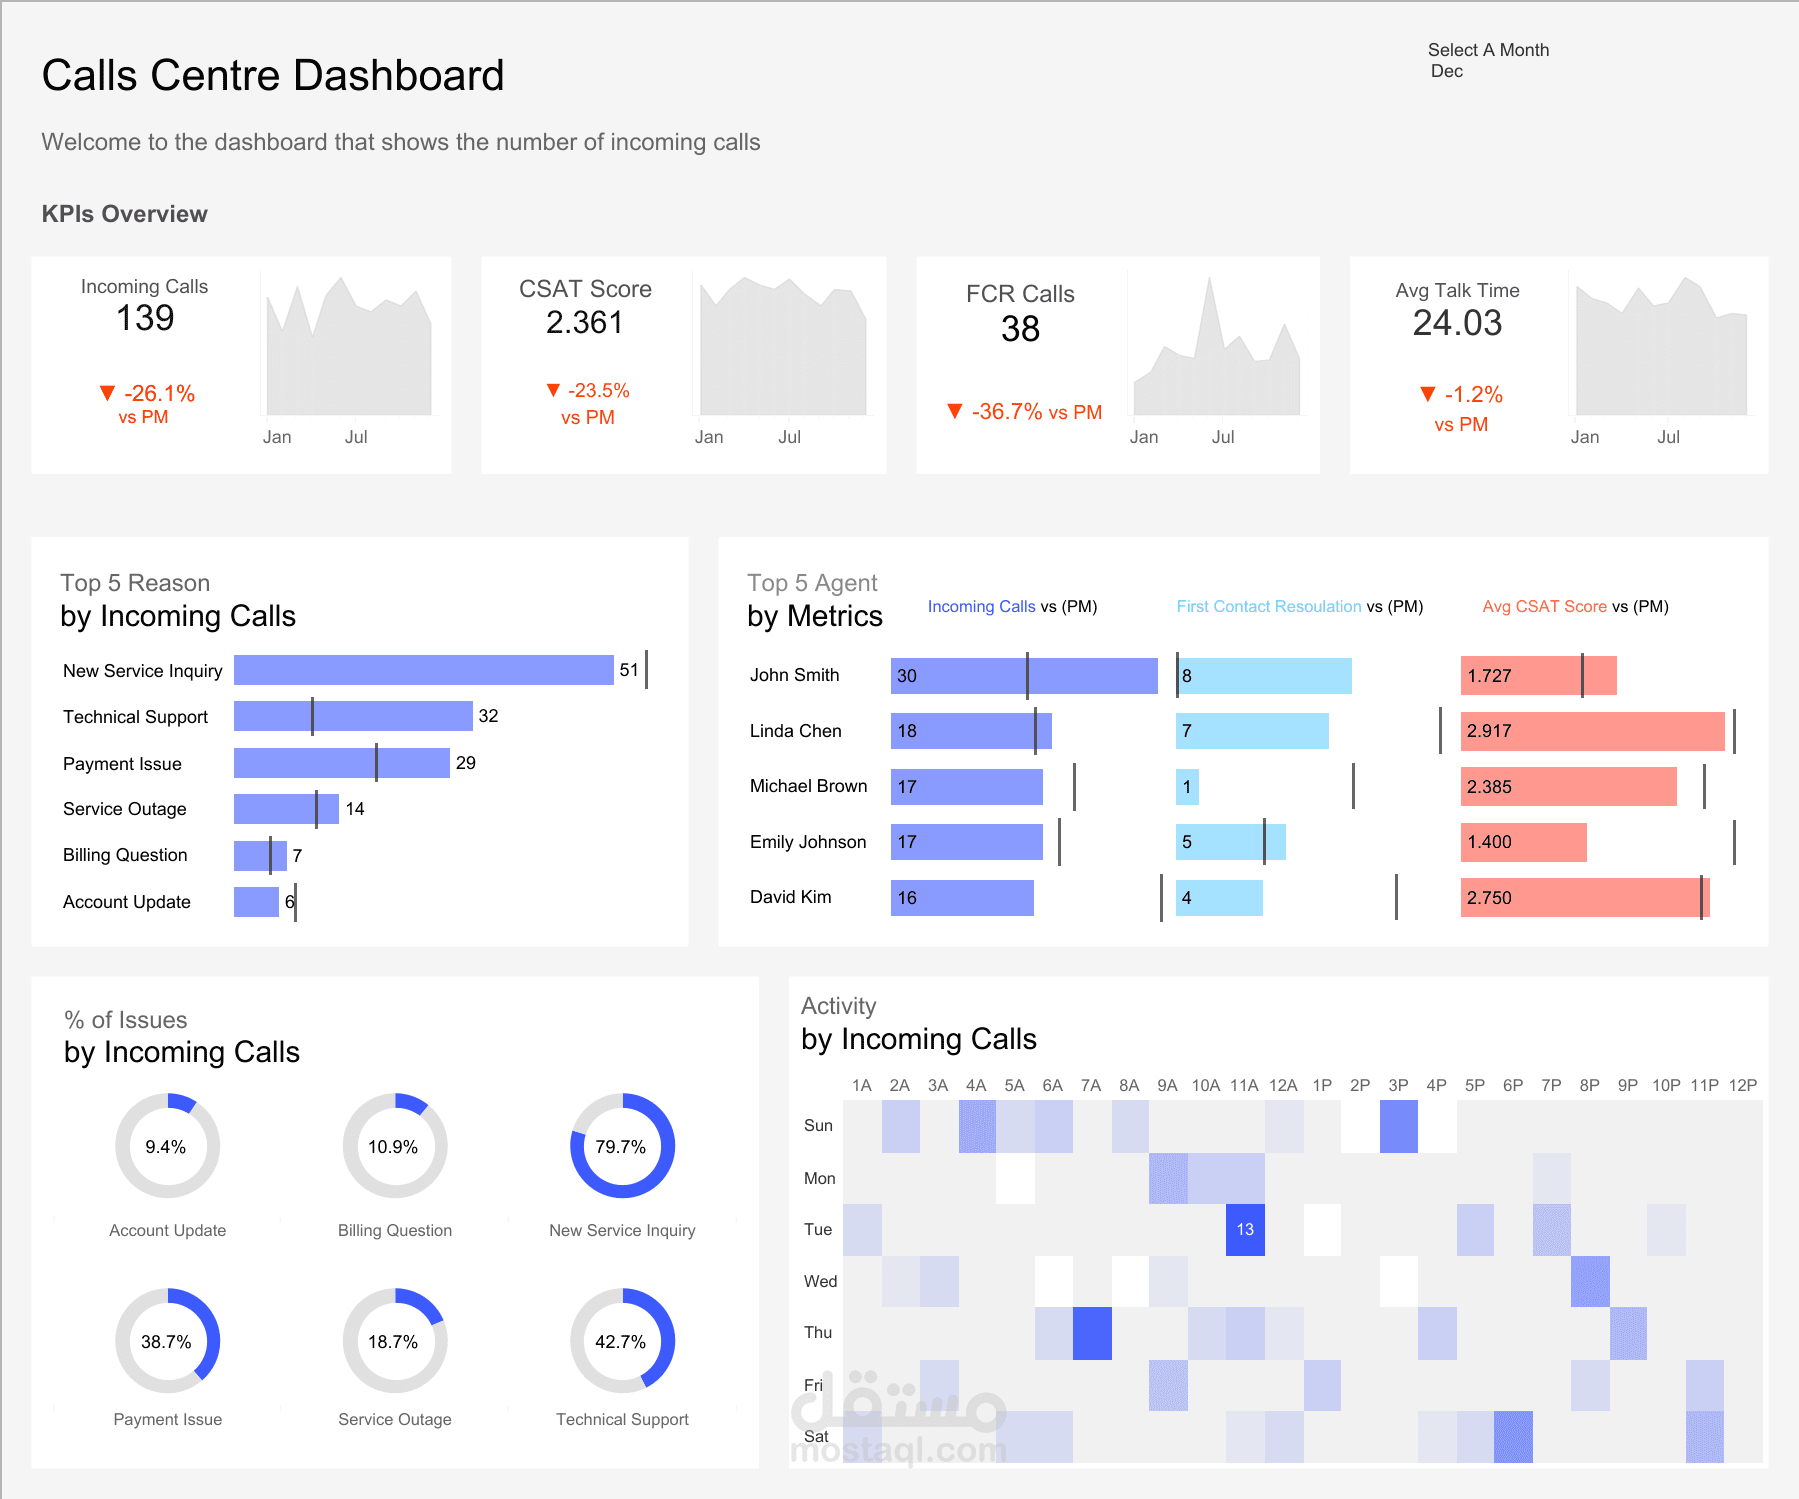
لوحة شهرية على Tableau لمتابعة أداء مركز الاتصال — حجم المكالمات، جودة الخدمة، وأداء الوكلاء في نظرة واحدة.
━━━━━━━━━━━━━━━━━━
🎯 الهدف | Purpose
Give operations & support managers one view to monitor call volume, service quality, and agent performance — and track how each metric moves month over month.
📈 أهم المؤشرات | Key Metrics (with sparklines vs. previous month)
📞 Incoming Calls: 139
⭐ CSAT: 2.36
✅ First Call Resolution (FCR) calls: 38
⏱️ Average Talk Time: 24.03 min
🗂️ التفاصيل | Breakdowns
🔝 Top 5 reasons by incoming calls
🏅 Top 5 agents by calls, FCR & CSAT (with reference lines)
🧩 Issues by type (%)
🔥 Activity heatmap by hour × weekday
🛠️ التفاعل | Interactivity
▫️ Month selector parameter
▫️ Reference / bullet lines for agent benchmarking
💡 أهم الاستنتاجات | Key Takeaways
✅ Hour × weekday heatmap reveals peak periods for better staffing
✅ Agent leaderboard highlights top performers & who needs coaching
✅ CSAT + FCR tracked together so quality issues surface early
🧰 الأدوات | Tools & Techniques
Tableau • Parameters • LOD calculations • KPI cards with sparklines • Bullet/reference lines • Heatmaps