Tackling Employee Attrition: An HR Analytics Dashboard
تفاصيل العمل
Description
A 4-page interactive Power BI dashboard analyzing employee attrition across three departments (Human Resources, Research & Development, Sales), designed to help HR leadership understand who is leaving, why, and how to reduce turnover costs.
Objective
To diagnose the scale and drivers of employee attrition (16.12% attrition rate, costing ~$6.81M), identify at-risk employee segments, and explore whether pay and satisfaction levels are contributing factors.
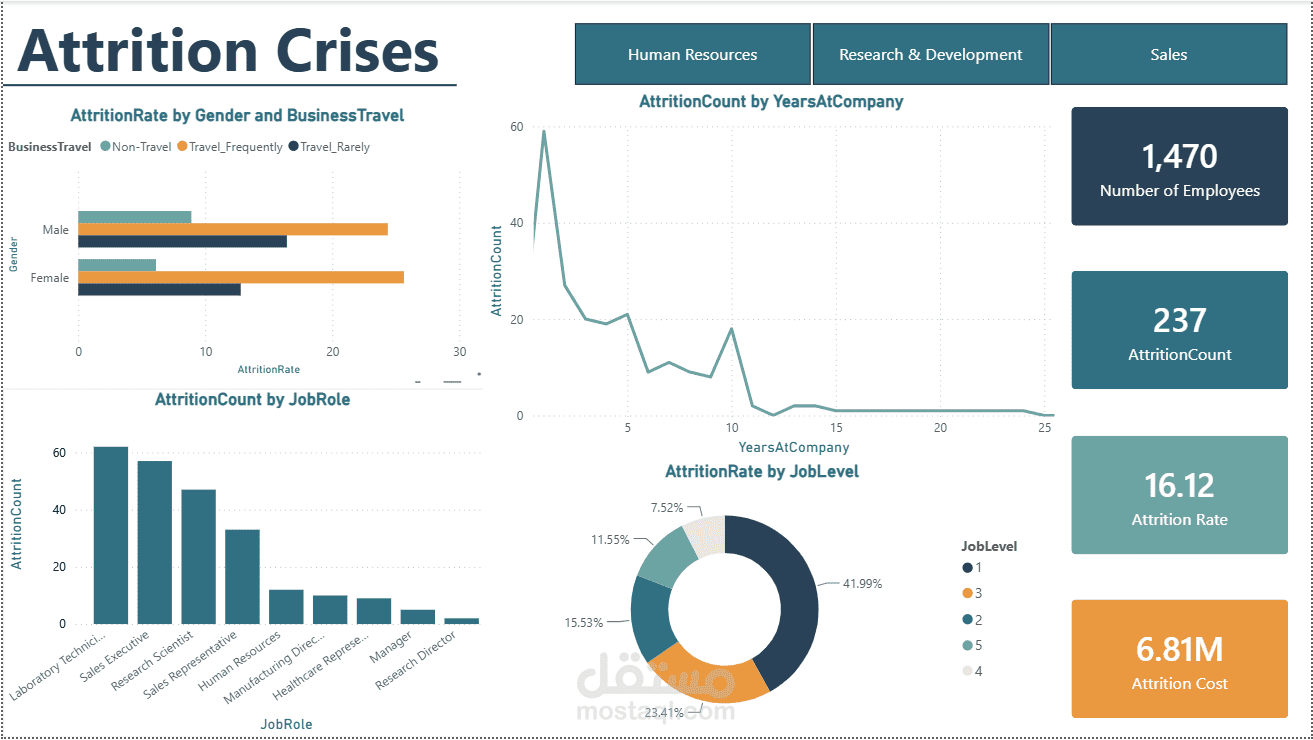
Attrition Crises
Key metrics: total employees (1,470), attrition count (237), attrition rate (16.12%), attrition cost ($6.81M)
Attrition breakdown by gender and business travel frequency
Job roles with highest attrition (Lab Technician, Sales Executive, Research Scientist)
Attrition vs. years at company (sharp spike within the first year)
Attrition rate distribution by job level
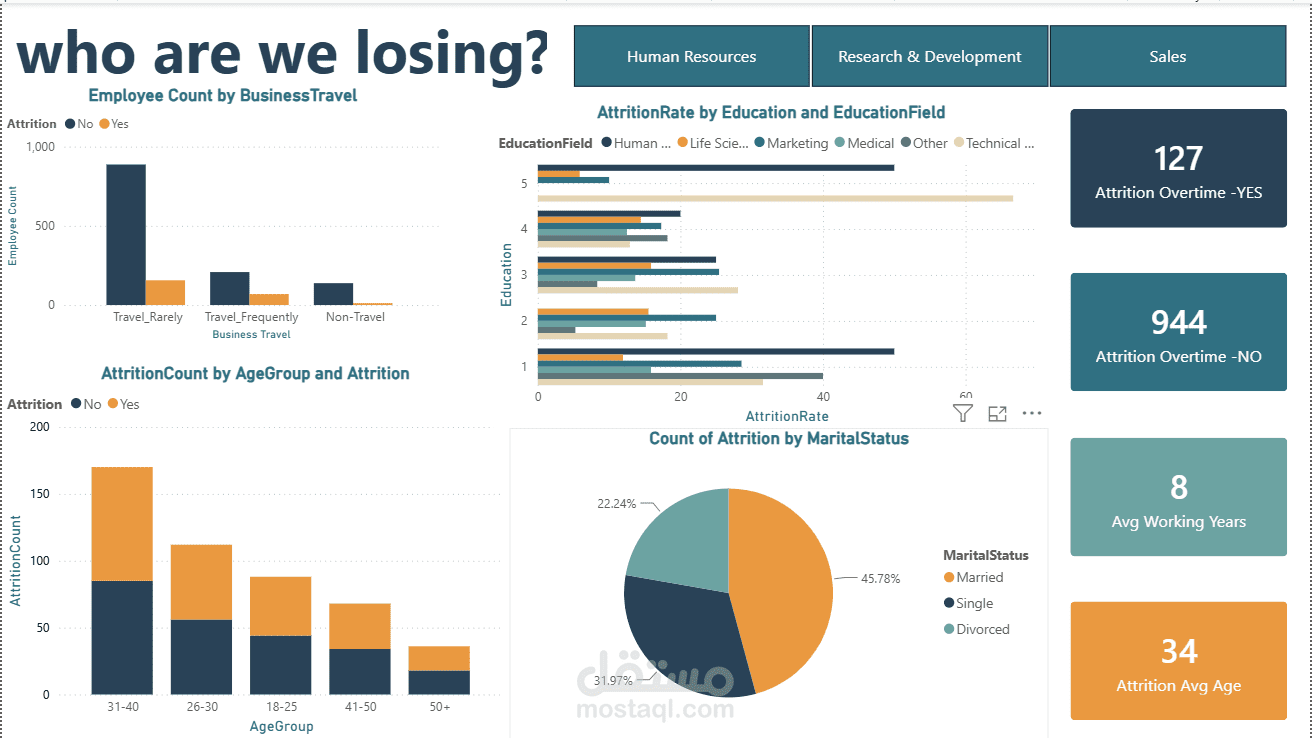
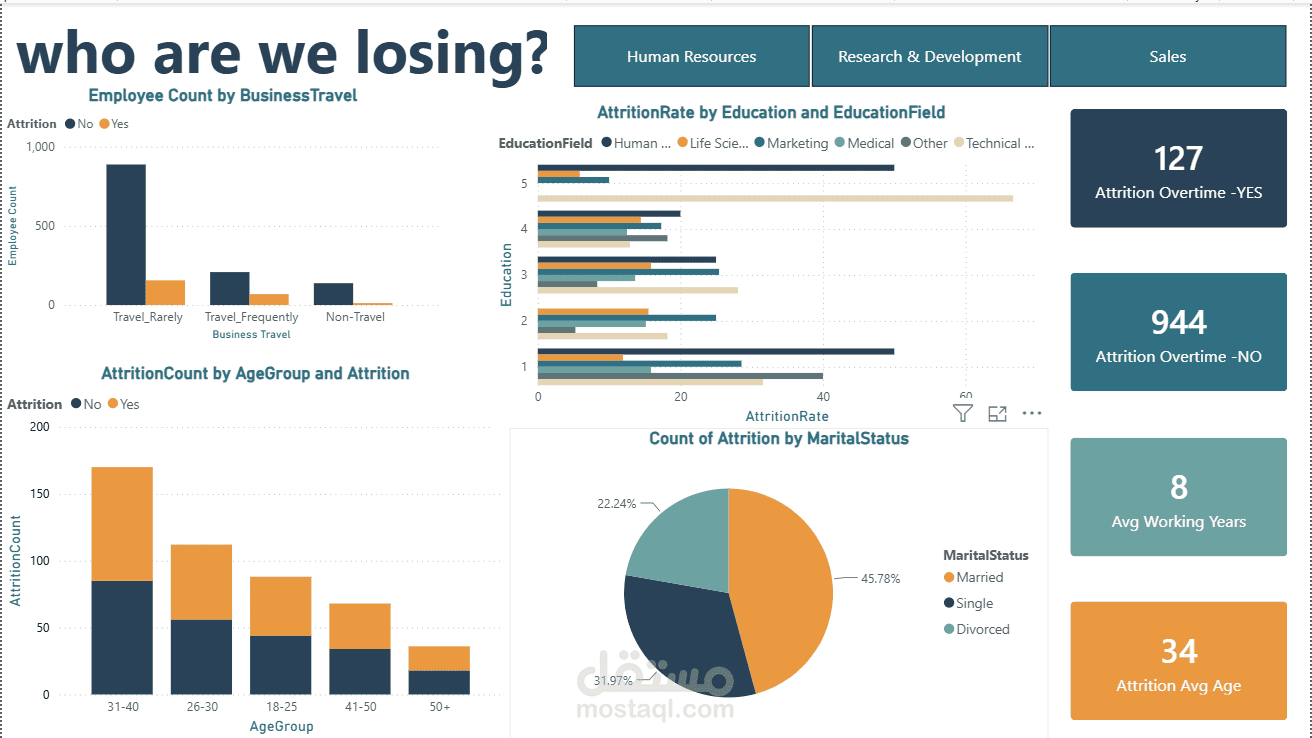
Who Are We Losing?
Breakdown by business travel and age group
Attrition rate by education level and field of study
Marital status of departing employees (married employees show the highest share)
Key metrics: overtime attrition split, average working years, average age at departure (34)
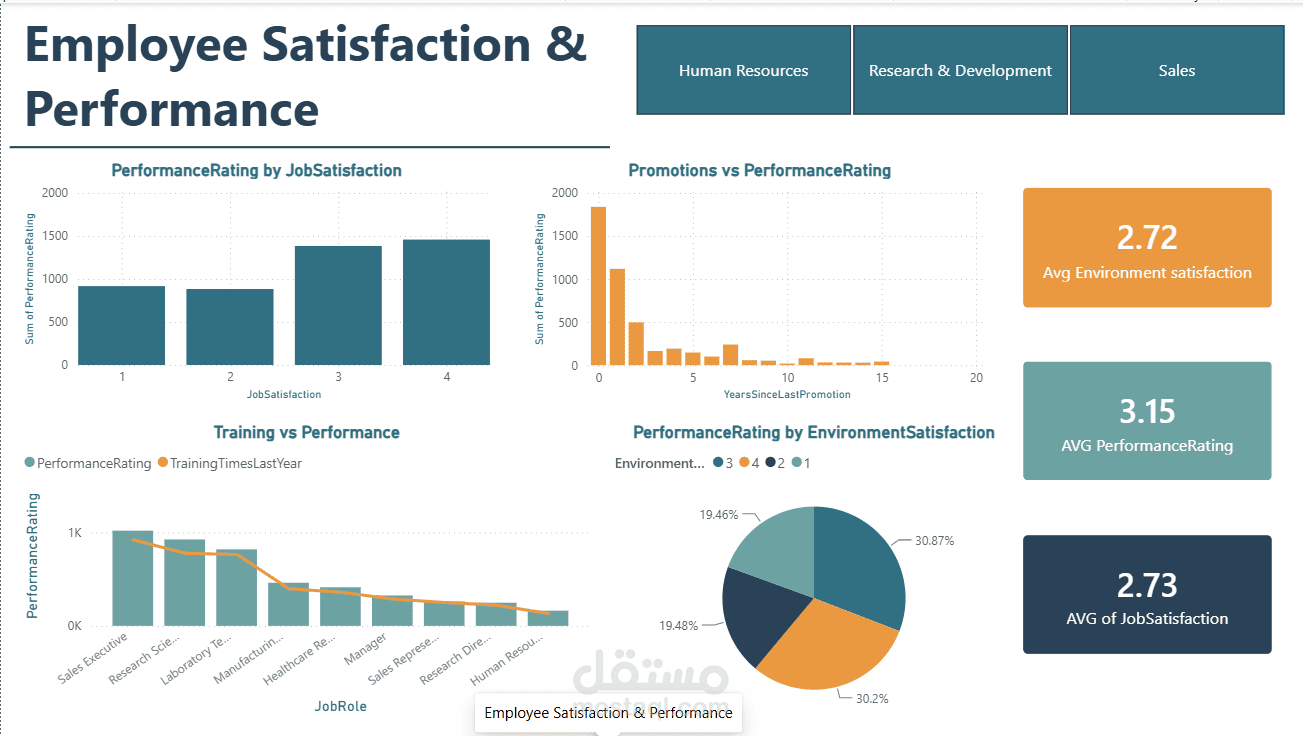
Employee Satisfaction & Performance
Performance rating vs. job satisfaction level
Promotions vs. performance rating
Training impact on performance over time
Performance rating by environment satisfaction
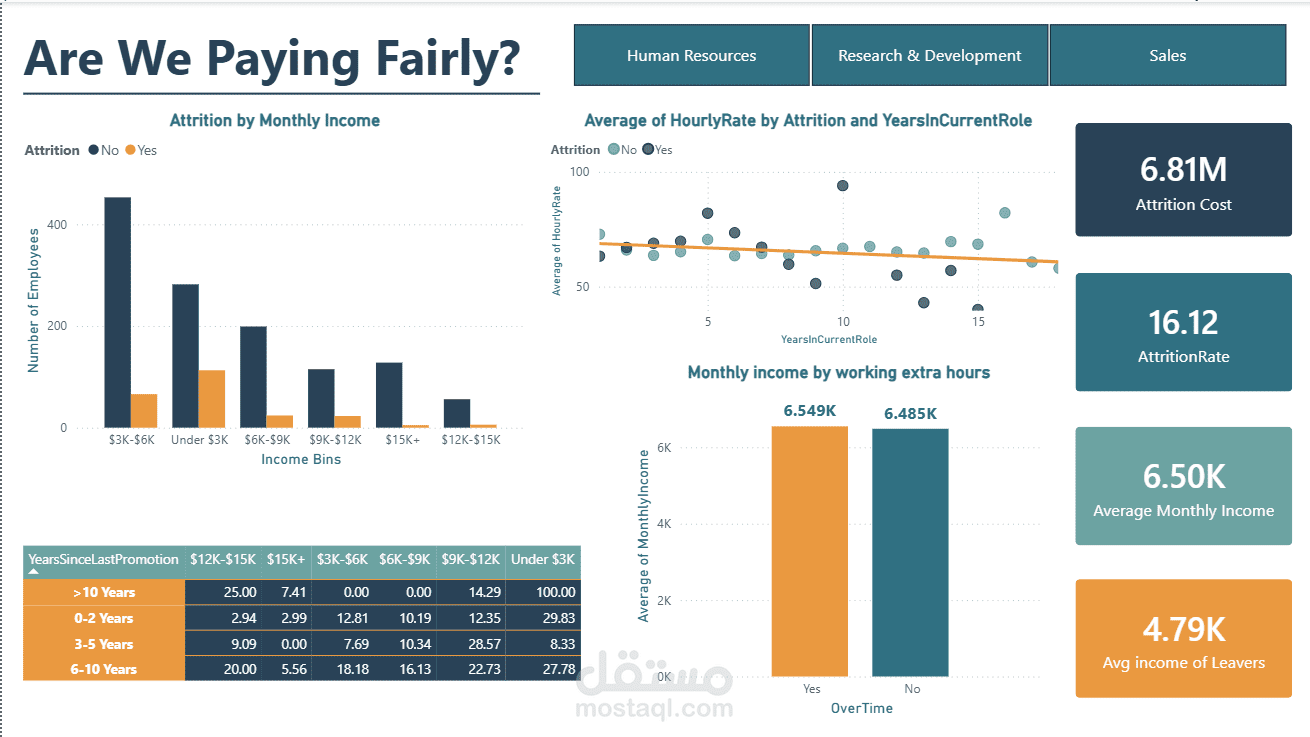
Are We Paying Fairly?
Attrition by monthly income bracket (highest attrition in lower income bins)
Hourly rate vs. years in current role, split by attrition status
Overtime's effect on average monthly income
Detailed table: years since last promotion vs. income bracket
Tools Used
Power BI · DAX · Power Query · Multi-page navigation with shared cross-department
filters
Key Insights
New employees (under 1 year tenure), those working overtime, and lower-income staff show the highest attrition risk. Delayed promotions and low environment satisfaction further correlate with turnover — pointing to actionable HR strategies around promotion cycles and targeted compensation reviews for high-risk groups.