Tackling Customer Churn: A Telecom Analytics Dashboard
تفاصيل العمل
Description
A 3-page interactive Power BI dashboard analyzing customer churn for a telecom company — identifying who is churning, why, and how the business can respond with data-driven retention strategies.
Objective
To pinpoint at-risk customers and uncover the root causes behind churn, enabling proactive strategies to reduce the current churn rate of 26.86%.
Churn Overview
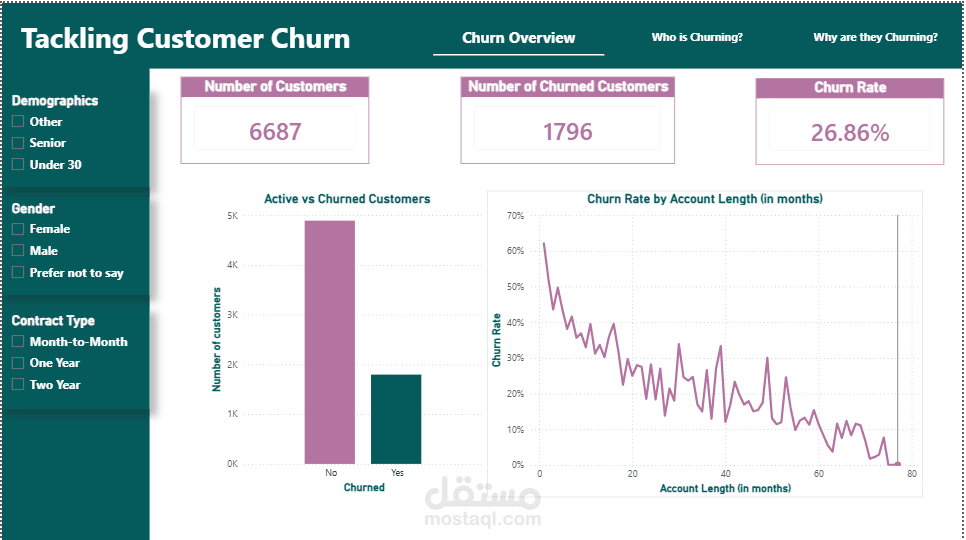
Total customers (6,687), churned customers (1,796), and overall churn rate
Active vs. churned customer comparison
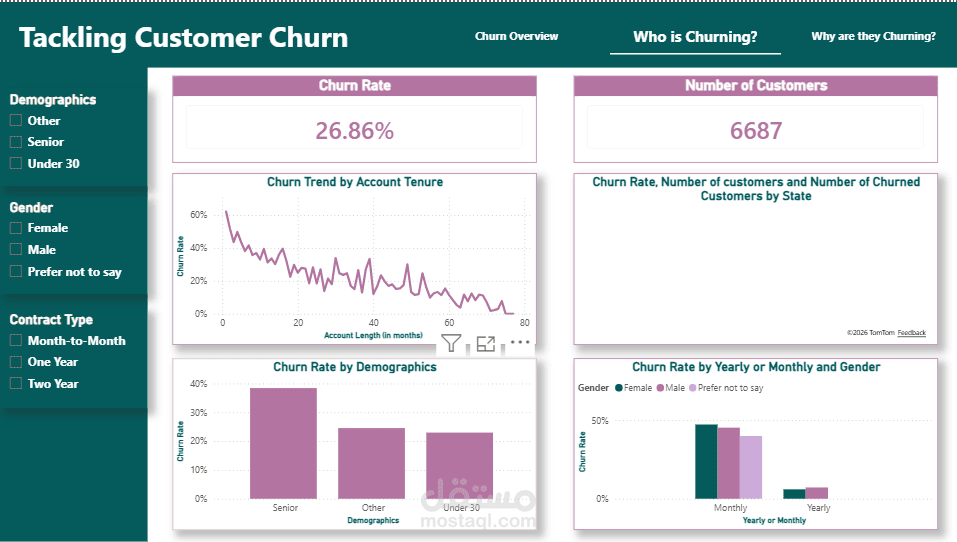
Churn rate by account tenure — showing churn is highest among new customers and declines as tenure increases
Who is Churning?
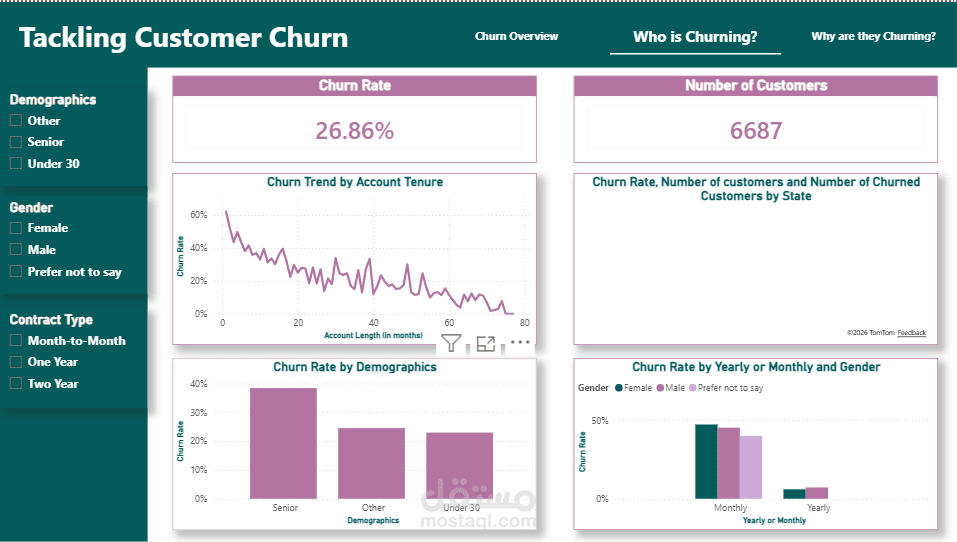
Churn rate breakdown by age group (seniors show the highest churn)
Analysis by gender and contract type (monthly vs. yearly)
Churn rate by state (map/table view)
Interactive slicers for demographics, gender, and contract type
Why are they Churning?
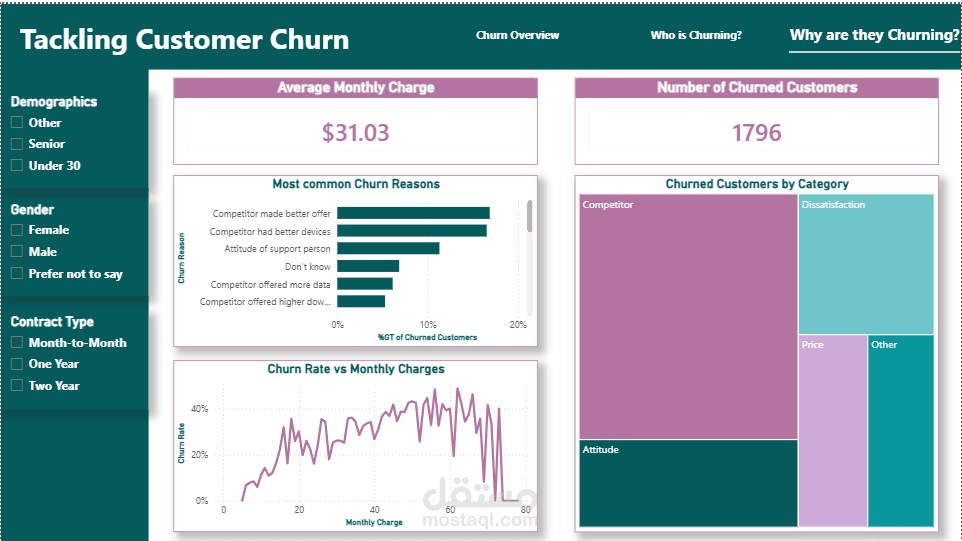
Most common churn reasons (competitor offers, better devices, poor customer support)
Churn reasons grouped into key categories (Competitor, Dissatisfaction, Price, Other) via treemap
Relationship between average monthly charge and churn rate
Tools Used
Power BI · DAX · Power Query · UX design for seamless multi-page navigation
Key Insights
New customers (especially within the first few months), month-to-month contract holders, and senior customers show the highest churn rates. Competitor offers and support quality are the leading drivers — pointing to actionable retention strategies such as improving the new-customer experience and incentivizing longer-term contracts.