Saudi Labor Market Dashboard: Workforce Localization & Demographics by Region
تفاصيل العمل
Description
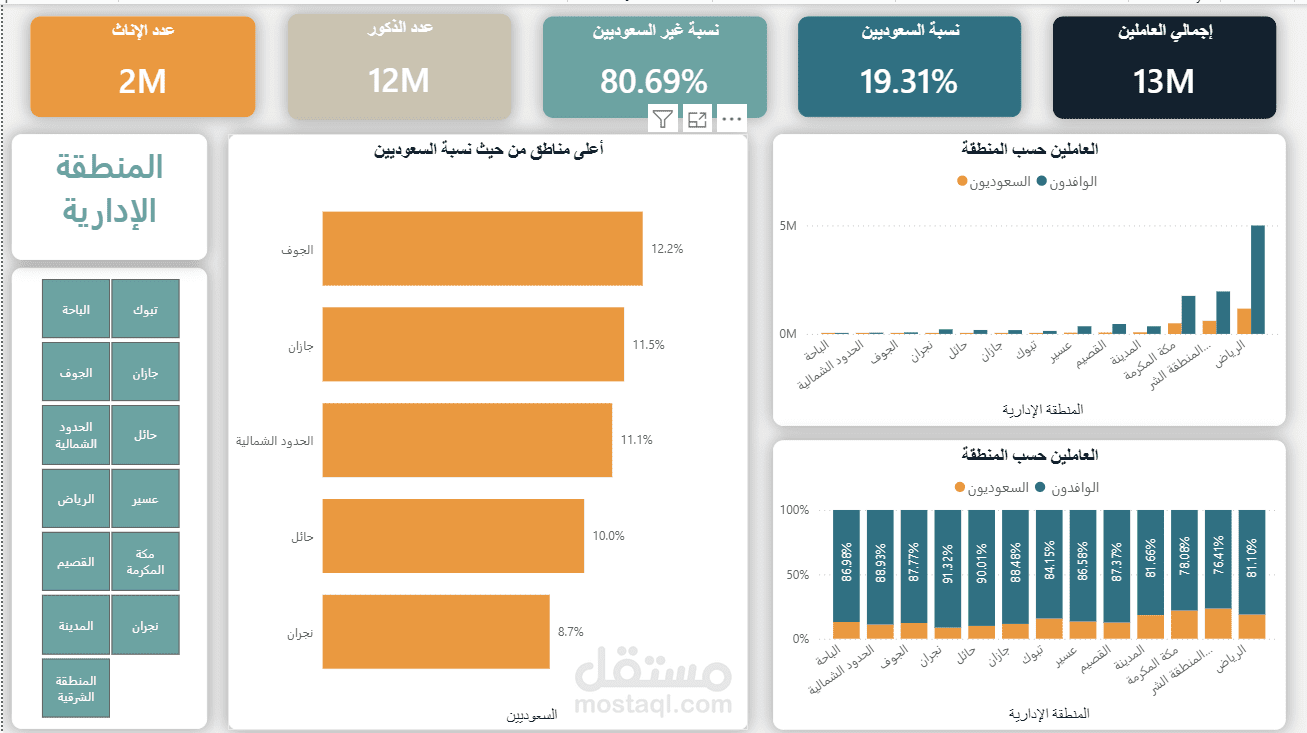
An interactive Power BI dashboard analyzing Saudi Arabia's workforce composition (13M workers) across the Kingdom's 13 administrative regions, with a focus on labor localization (Saudization) and demographic distribution.
Objective
To visualize the balance between Saudi and expatriate workers across regions, identify areas with the highest and lowest localization rates, and support data-driven decisions aligned with Saudization initiatives and Vision 2030.
Key Features
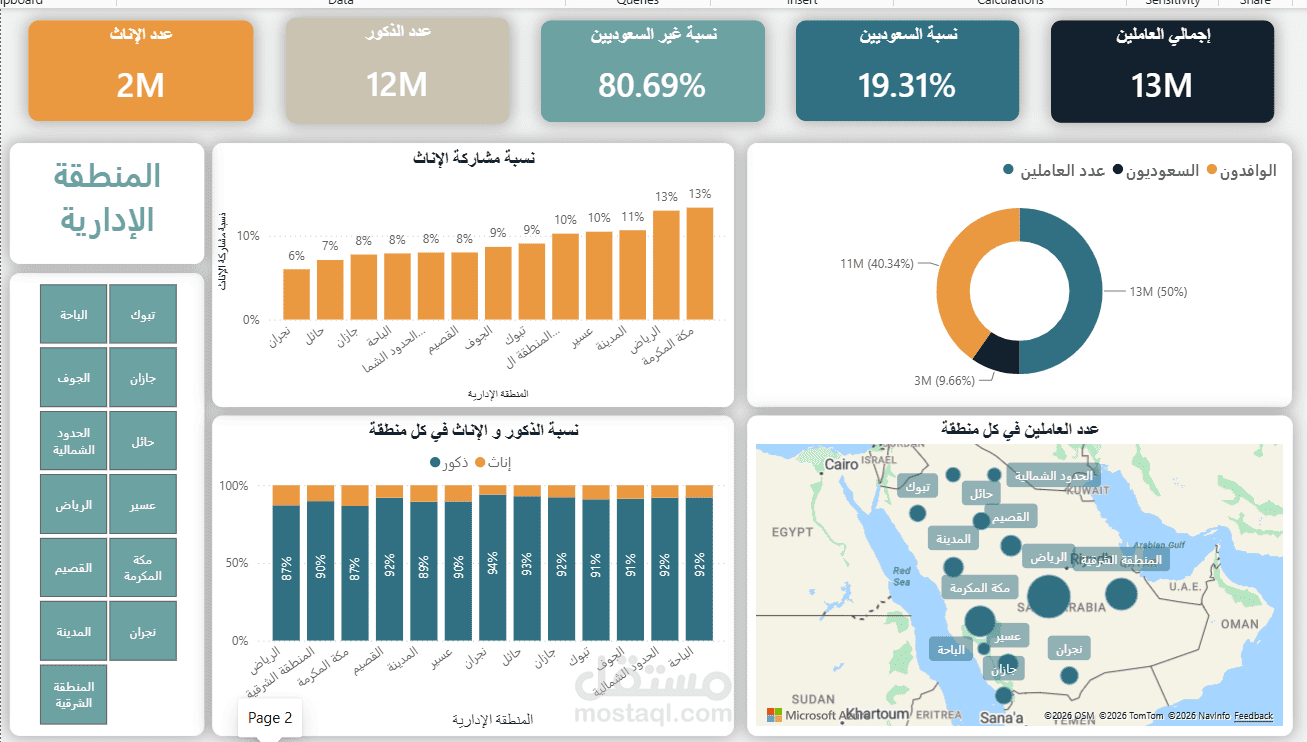
KPI cards summarizing total workforce, gender split (12M male / 2M female), and Saudi vs. non-Saudi ratios (19.31% / 80.69%)
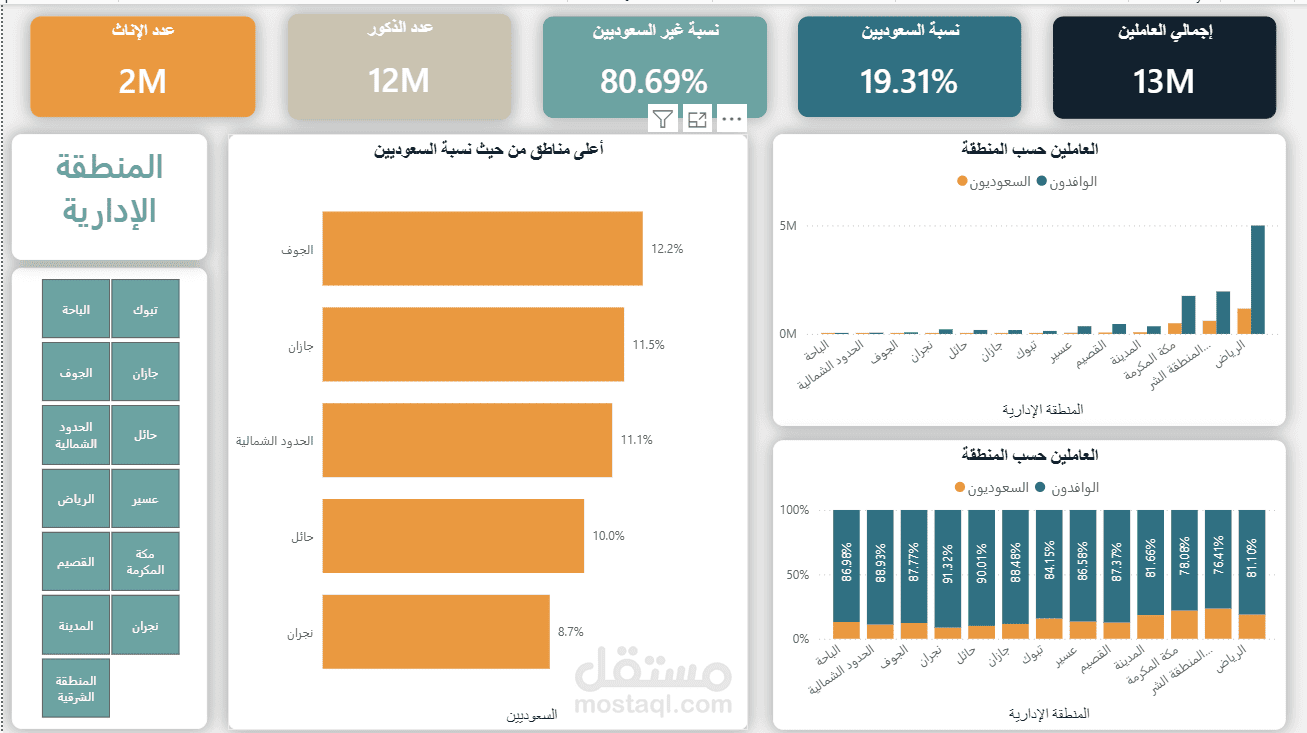
Ranked bar chart of top regions by Saudization rate (Al-Jouf leads at 12.2%)
Side-by-side comparison of Saudi vs. expat workers by region, in both counts and percentages
Female workforce participation rate by region
Donut chart showing overall workforce distribution (Saudis, expats, total)
Interactive bubble map visualizing workforce density across regions
Region slicers for quick, dynamic filtering across all visuals
Bilingual (Arabic/English) dashboard design
Tools Used
Power BI · DAX · Power Query · Data Modeling
Key Insights
The analysis reveals notable disparities in Saudization rates across regions — border regions like Al-Jouf and Northern Borders show relatively higher localization, while major economic hubs such as Riyadh and Makkah rely more heavily on expatriate labor.