Modern admin dashboard
تفاصيل العمل
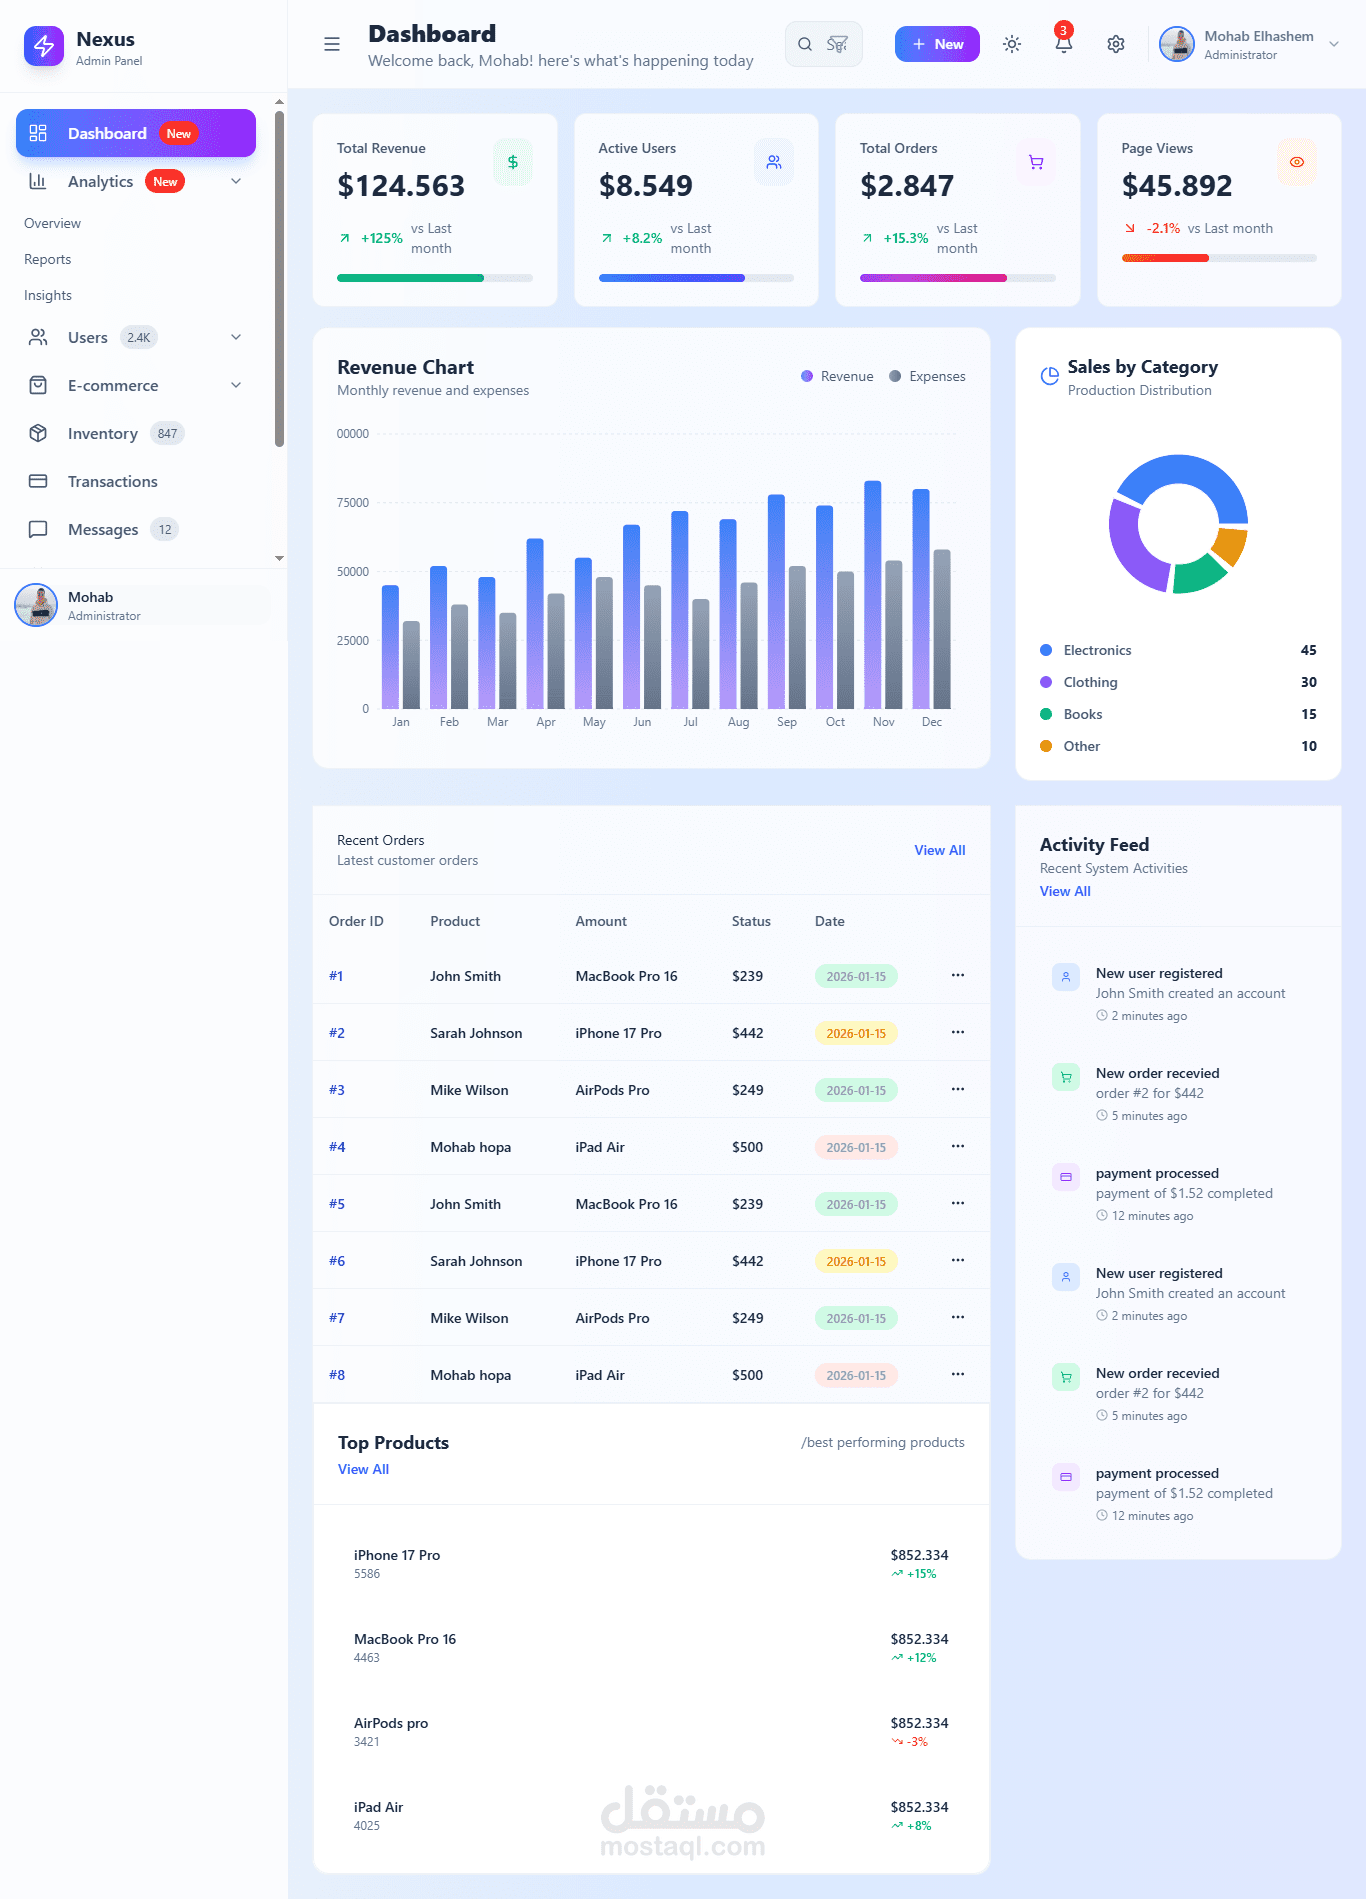
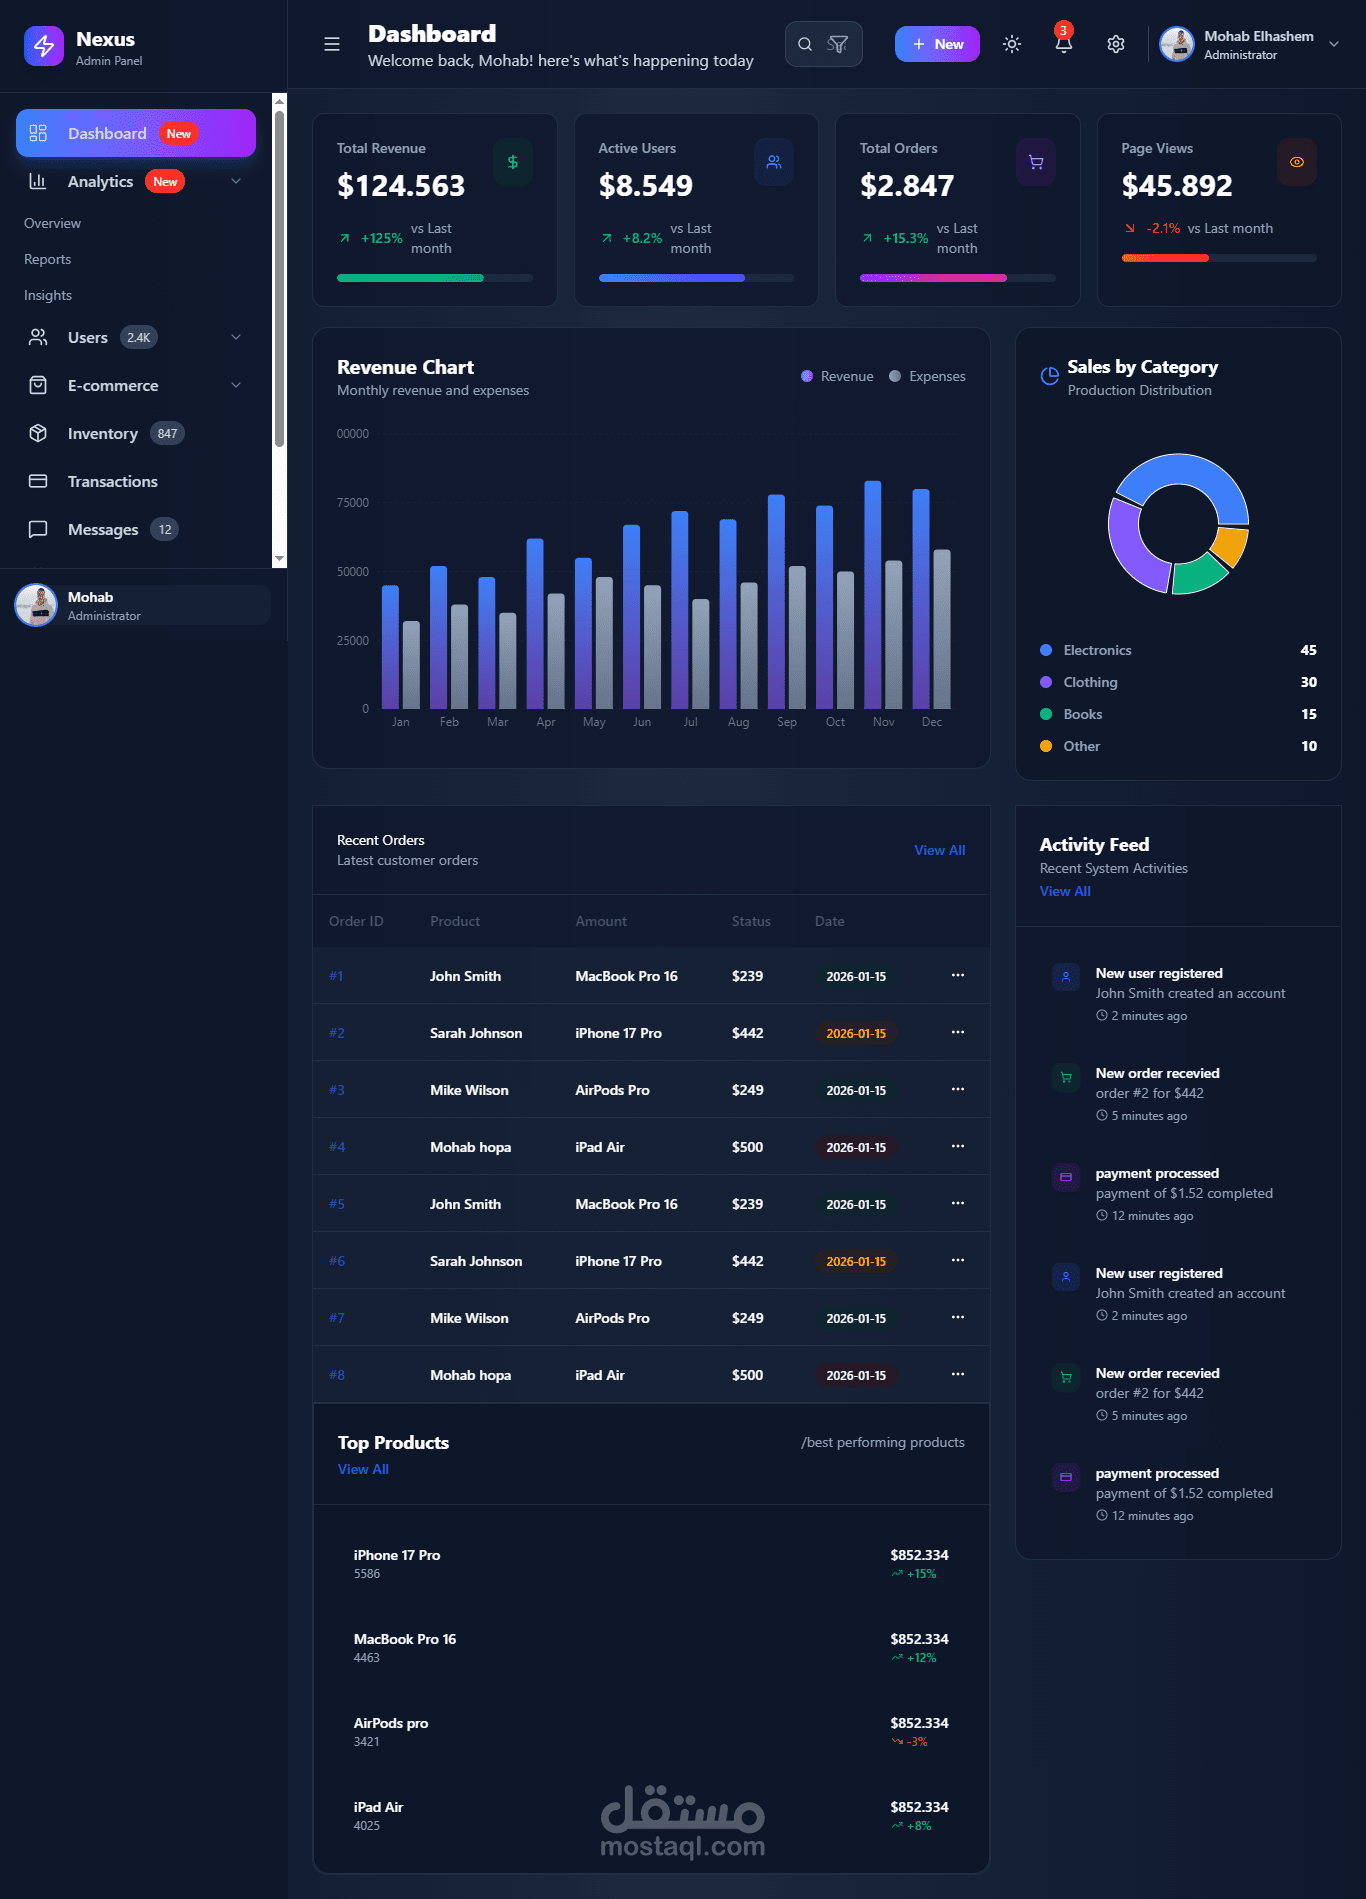
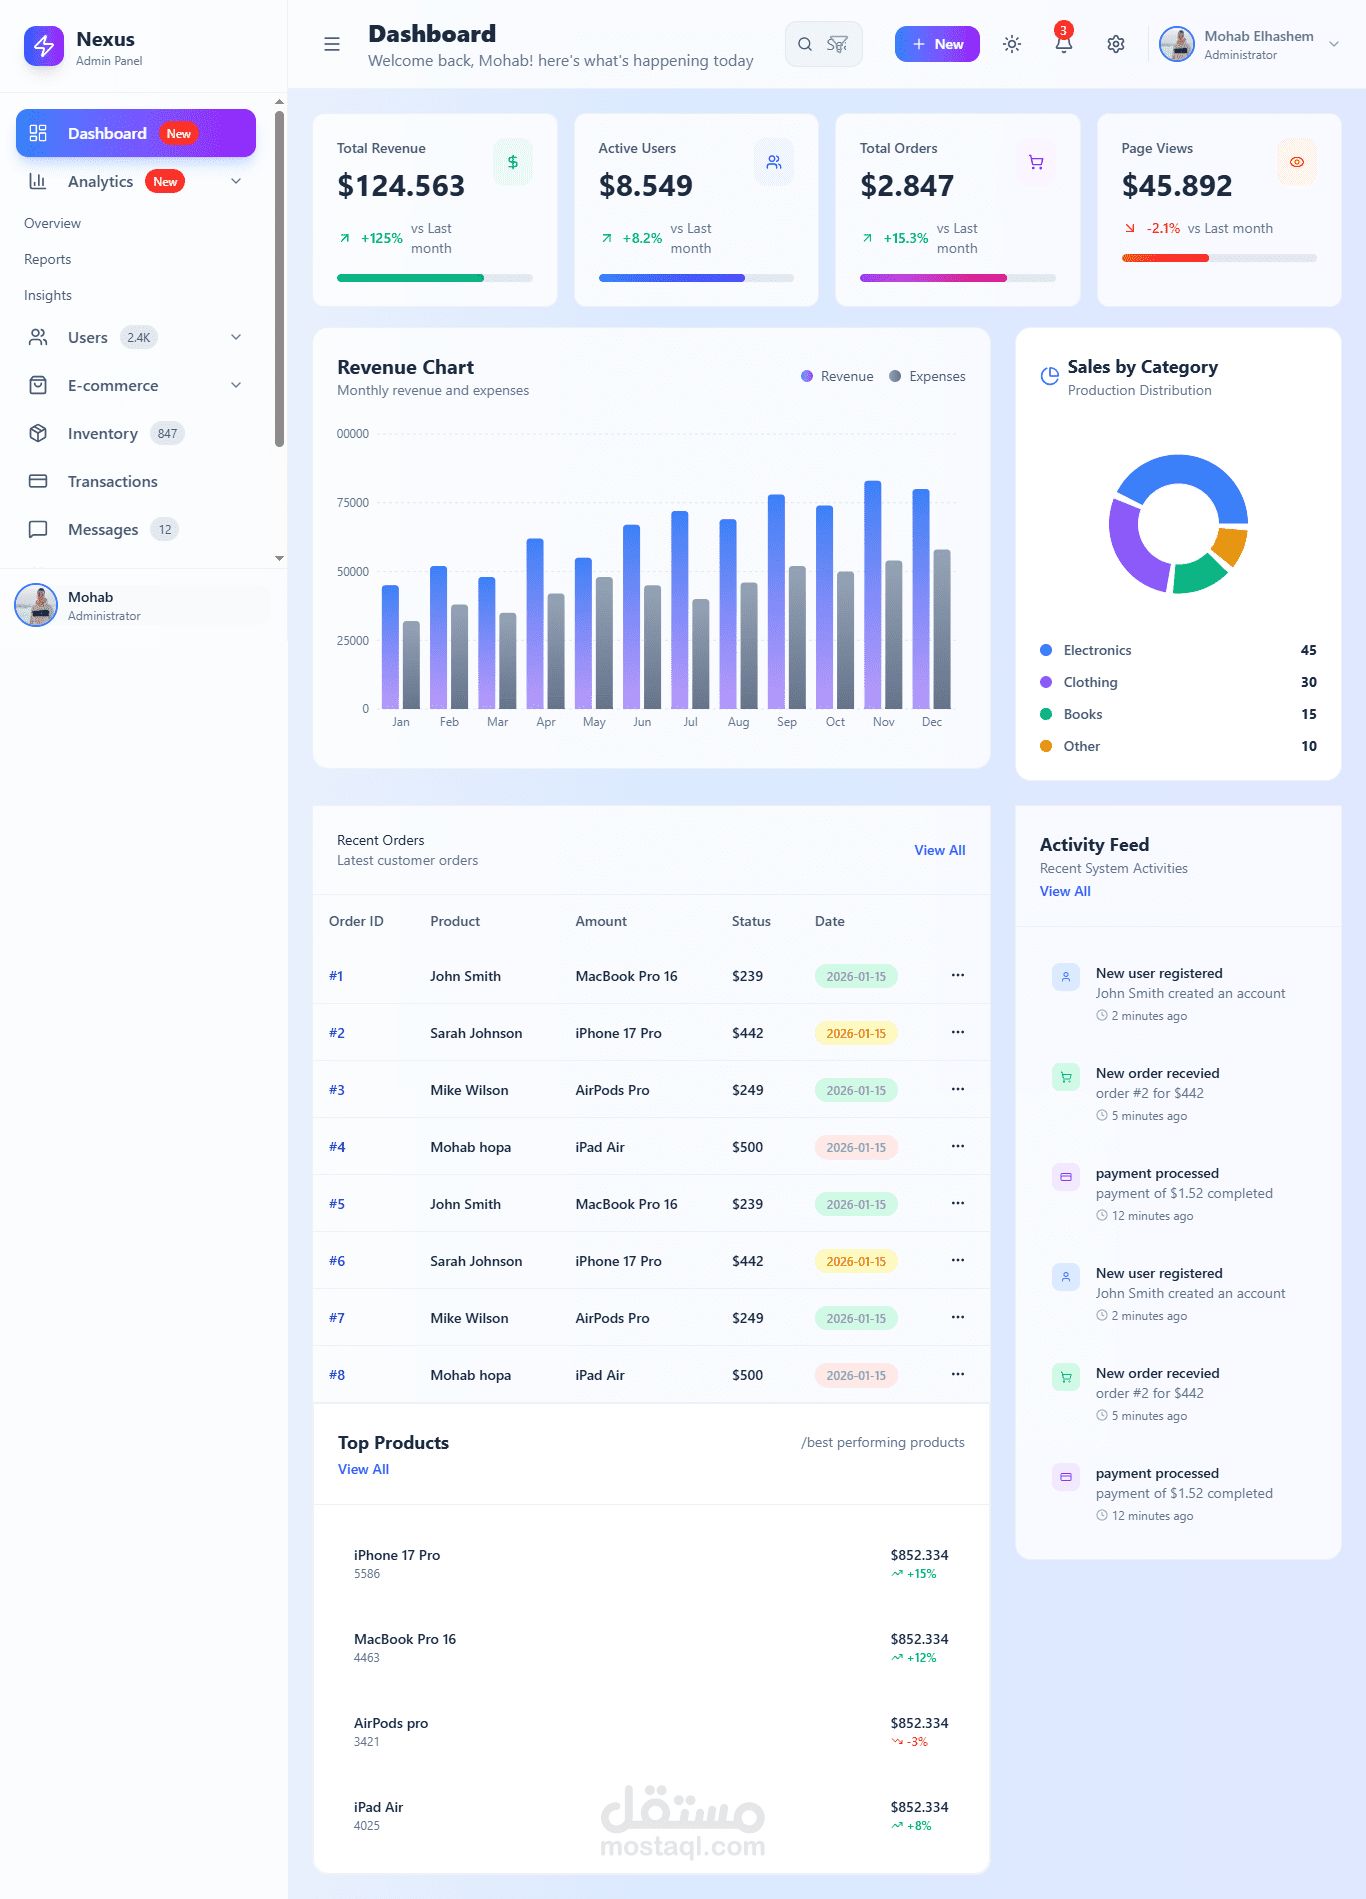
Interactive Analytics & Business Intelligence Dashboard
Developed a high-performance, executive-level analytics dashboard designed to visualize complex data structures and streamline business monitoring.
Key Deliverables & Achievements:
Rock-Solid Architecture: Engineered using React and TypeScript to enforce absolute type safety, eliminating runtime errors and creating a highly maintainable codebase.
Advanced Data Visualization: Implemented interactive, dynamic charts and key performance indicators (KPIs) using Recharts to bring complex data to life.
Responsive Design & Dark Mode: Built a fluid, mobile-responsive layout utilizing Tailwind CSS, complete with a seamless, system-integrated Dark/Light mode toggle.
Performance-First Workflow: Optimized asset bundling and loading speeds using Vite, ensuring near-instantaneous dashboard rendering and smooth transitions.