Superstore Sales Analysis Dashboard-Power BI
تفاصيل العمل
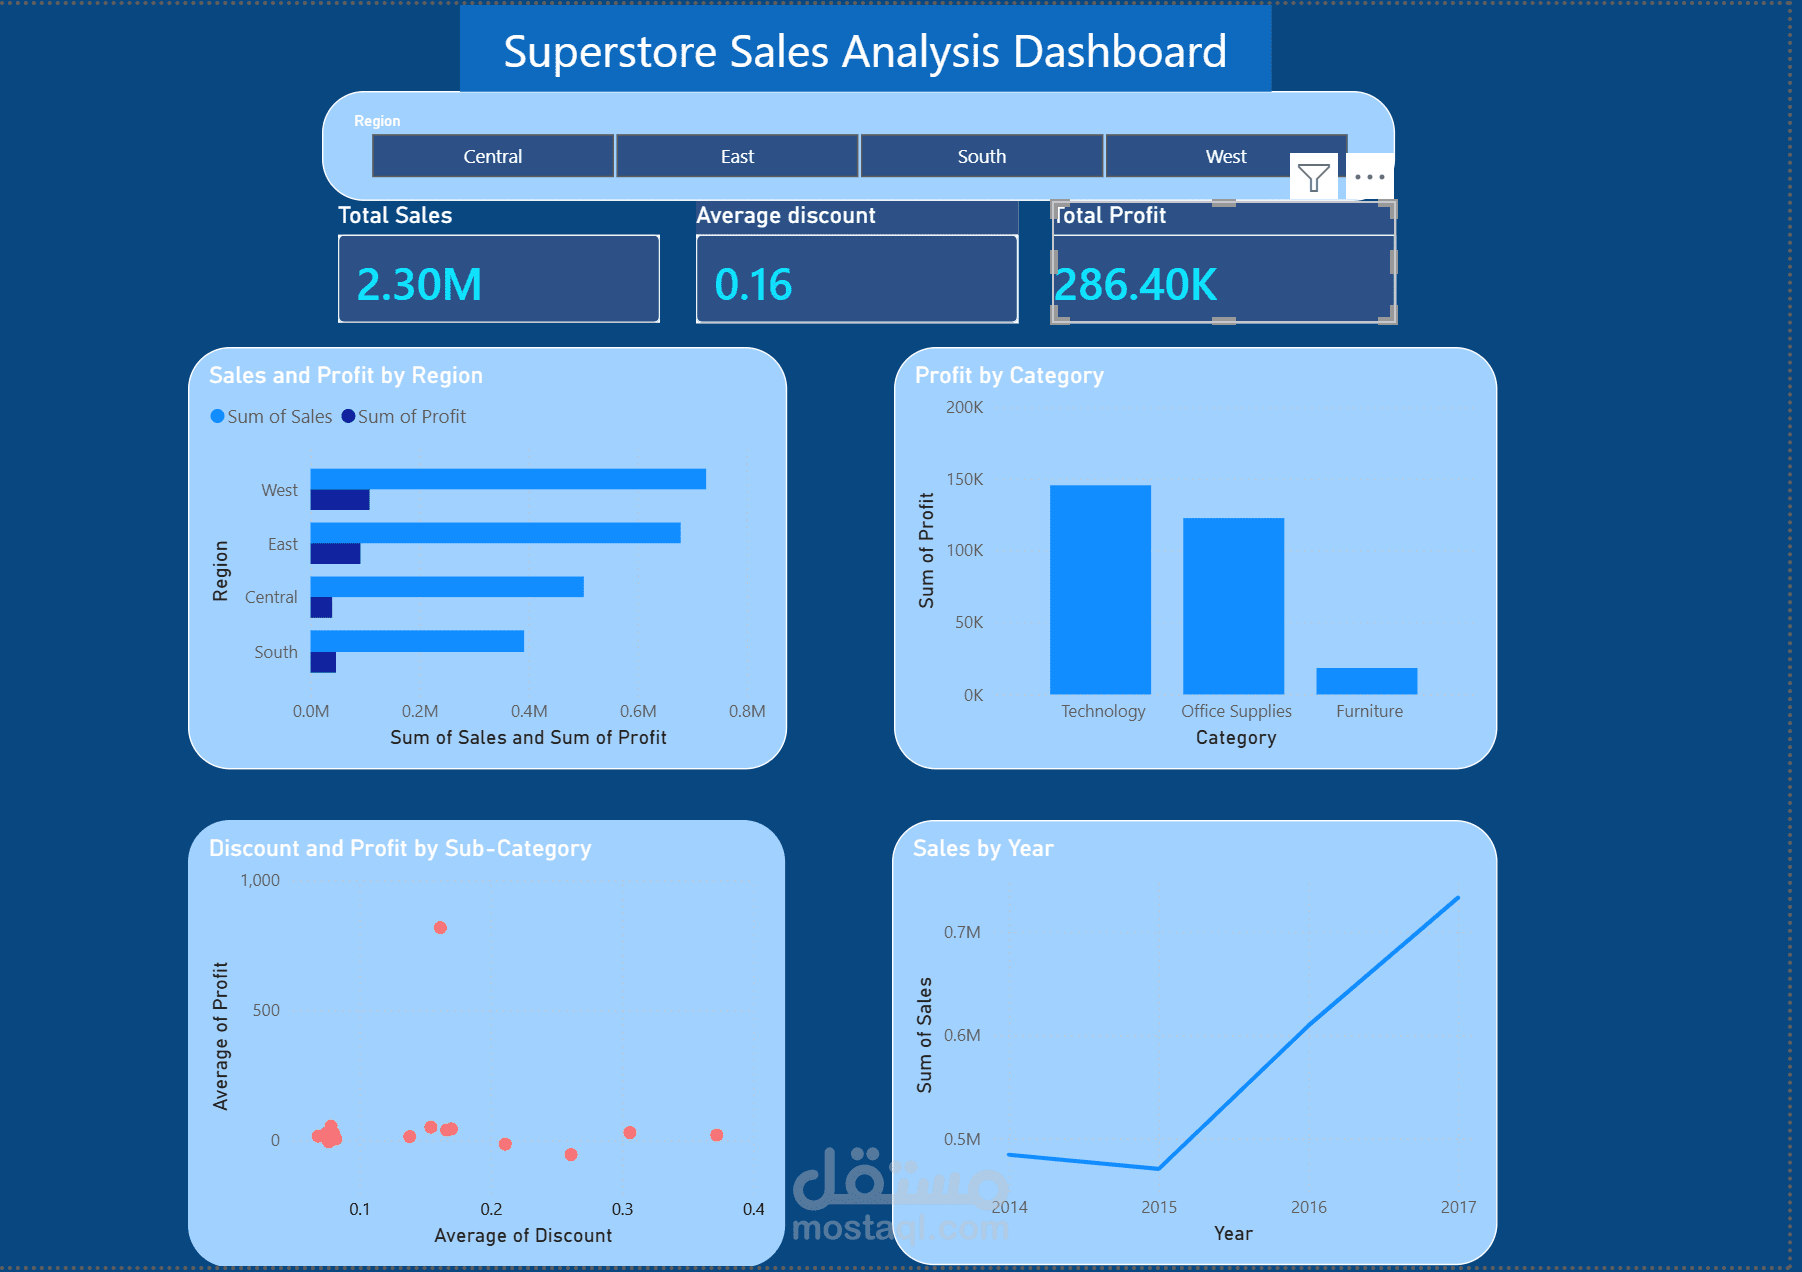
Built a fully interactive Power BI dashboard analysing 9,994 sales transactions across regions, categories, and years. Dashboard includes KPI cards, interactive region slicer, bar charts, scatter plot, and line chart. Key findings: West region leads in sales and profit; Technology is most profitable category; heavy discounting correlates with negative profit. Tools: Power BI Desktop, Data Visualization, Dashboard Design