Comprehensive Dashboard for Analyzing E-commerce Store (Mega Store) Sales Using SQL and Power BI
تفاصيل العمل
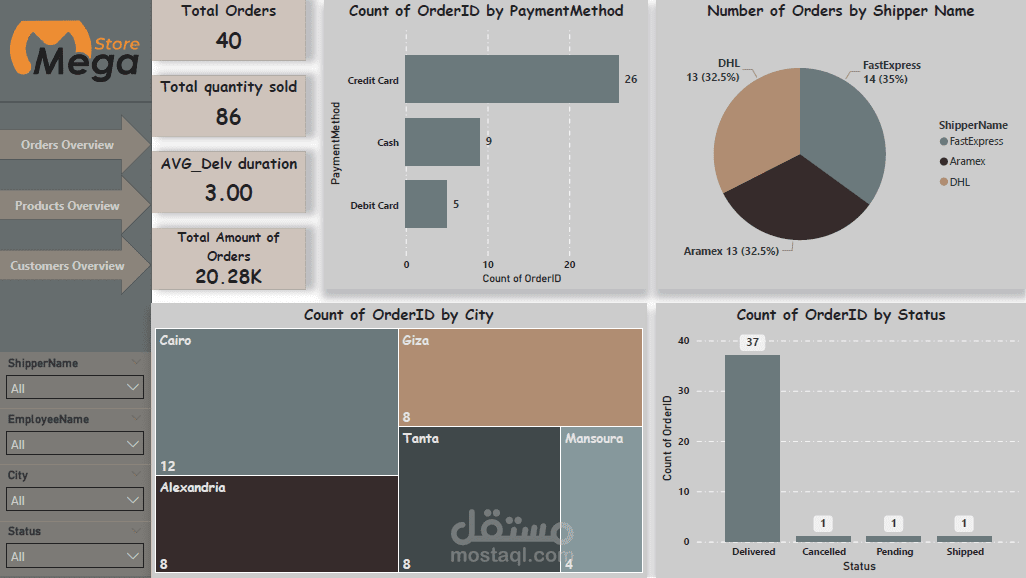
A comprehensive data analysis project for an online store ("Mega Store") aimed at deriving insights regarding sales, product performance, and customer behavior to support operational and marketing decision-making.
Work Methodology and Data Architecture:
Data was imported and structured using the `megaecommerce_Project.sql` database file.
A data model was designed, and tables (Categories, Customers, Orders, Products, Shipments, Suppliers) were linked to ensure reporting accuracy.
Custom measures and metrics were created using DAX to accurately calculate key performance indicators (KPIs).
Dashboard Components (3 interactive pages):
1. Orders Overview:
Track total orders (40 orders), total quantities sold (86 items), and total sales volume ($20.28K).
Analyze the most frequently used payment methods (with credit cards leading the list).
Visualize the geographical distribution of orders across governorates (Cairo, Alexandria, Giza, etc.) using a Treemap.
Measure average shipping and delivery times (AVG Delivery Duration) and monitor order statuses (Delivered, Cancelled, Pending).
2. Products and Suppliers Analysis (Products Overview):
Monitor top-priced products and compare them against actual order volumes (Line and Stacked Column Chart).
Analyze supplier market shares (Supplier Shares) and identify the store's top suppliers.
Categorize the distribution of products and orders by major categories (Electronics, Clothing, Books, Sports, Home Appliances).
3. Customer Behavior Analysis (Customers Overview):
Tracking customer counts and ratings (overall average rating: 4.60).
Identifying top-purchasing and highest-spending customers to target marketing campaigns and loyalty programs.
Tools and features used:
SQL, Power BI, DAX, Data Modeling, Advanced Filters & Slicers.