Egyptian Food Analysis Dashboard | Power BI
تفاصيل العمل
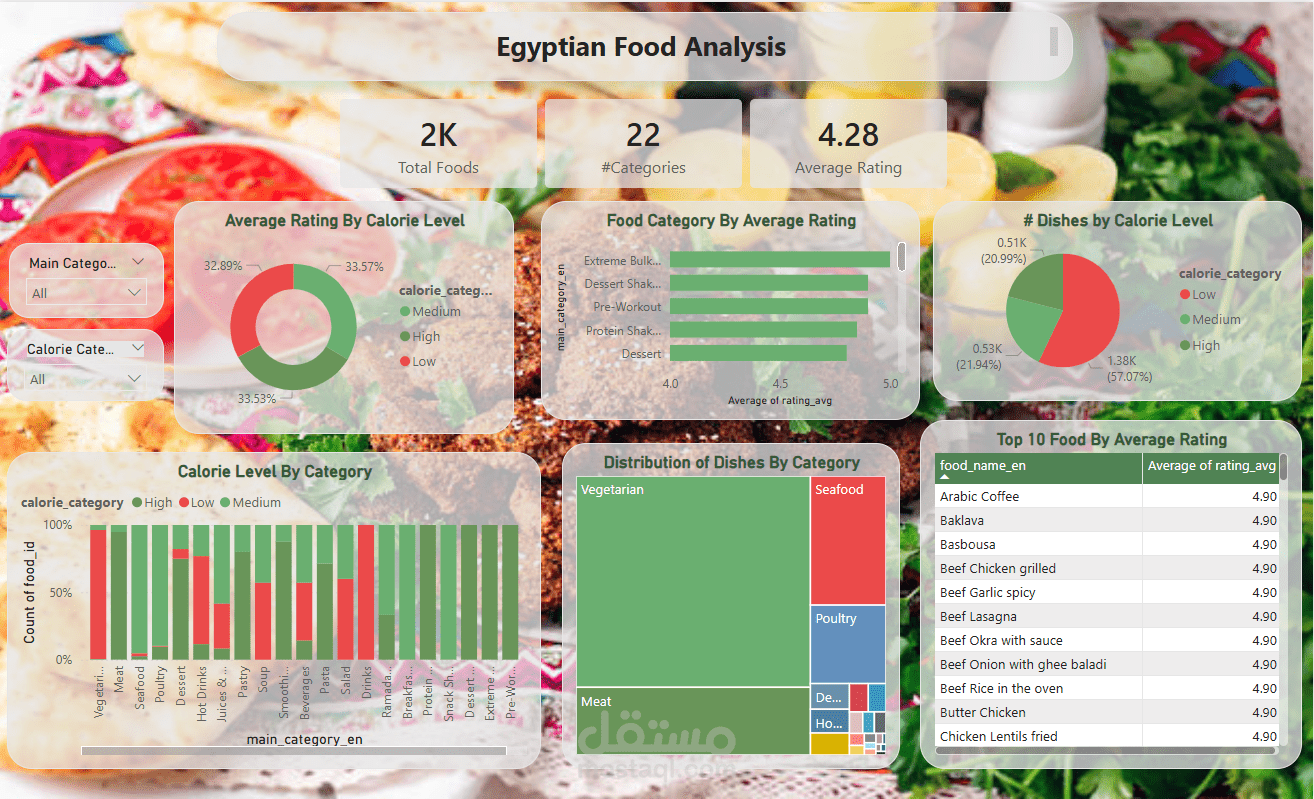
Interactive Egyptian Food Analysis Dashboard | Power BI
Designed and developed an interactive Power BI dashboard to analyze an Egyptian food dataset and present valuable insights through clear and interactive visualizations.
Project Features:
Data Cleaning & Transformation using Power Query
Data Modeling
DAX Measures
Interactive Dashboard with Slicers
Total Foods, Categories, and Average Rating KPIs
Average Rating Analysis by Calorie Level
Food Categories Ranked by Average Rating
Distribution of Dishes by Category
Top 10 Highest-Rated Egyptian Dishes
Interactive filtering for easier data exploration
This dashboard enables users to explore Egyptian food categories, compare ratings, analyze calorie levels, and identify the highest-rated dishes through an intuitive and interactive reporting experience.
Tools & Technologies Used:
Microsoft Power BI
Power Query
Data Modeling
DAX Measures
Data Visualization
Interactive Reports