U.S. Labor Market Insights
تفاصيل العمل
📊 U.S. Labor Market Insights!
I took a deep dive into data on employment and wages across the United States, focusing on 2017. This visualization highlights trends and provides valuable insights for anyone interested in the U.S. job landscape.
🔹 Key Highlights:
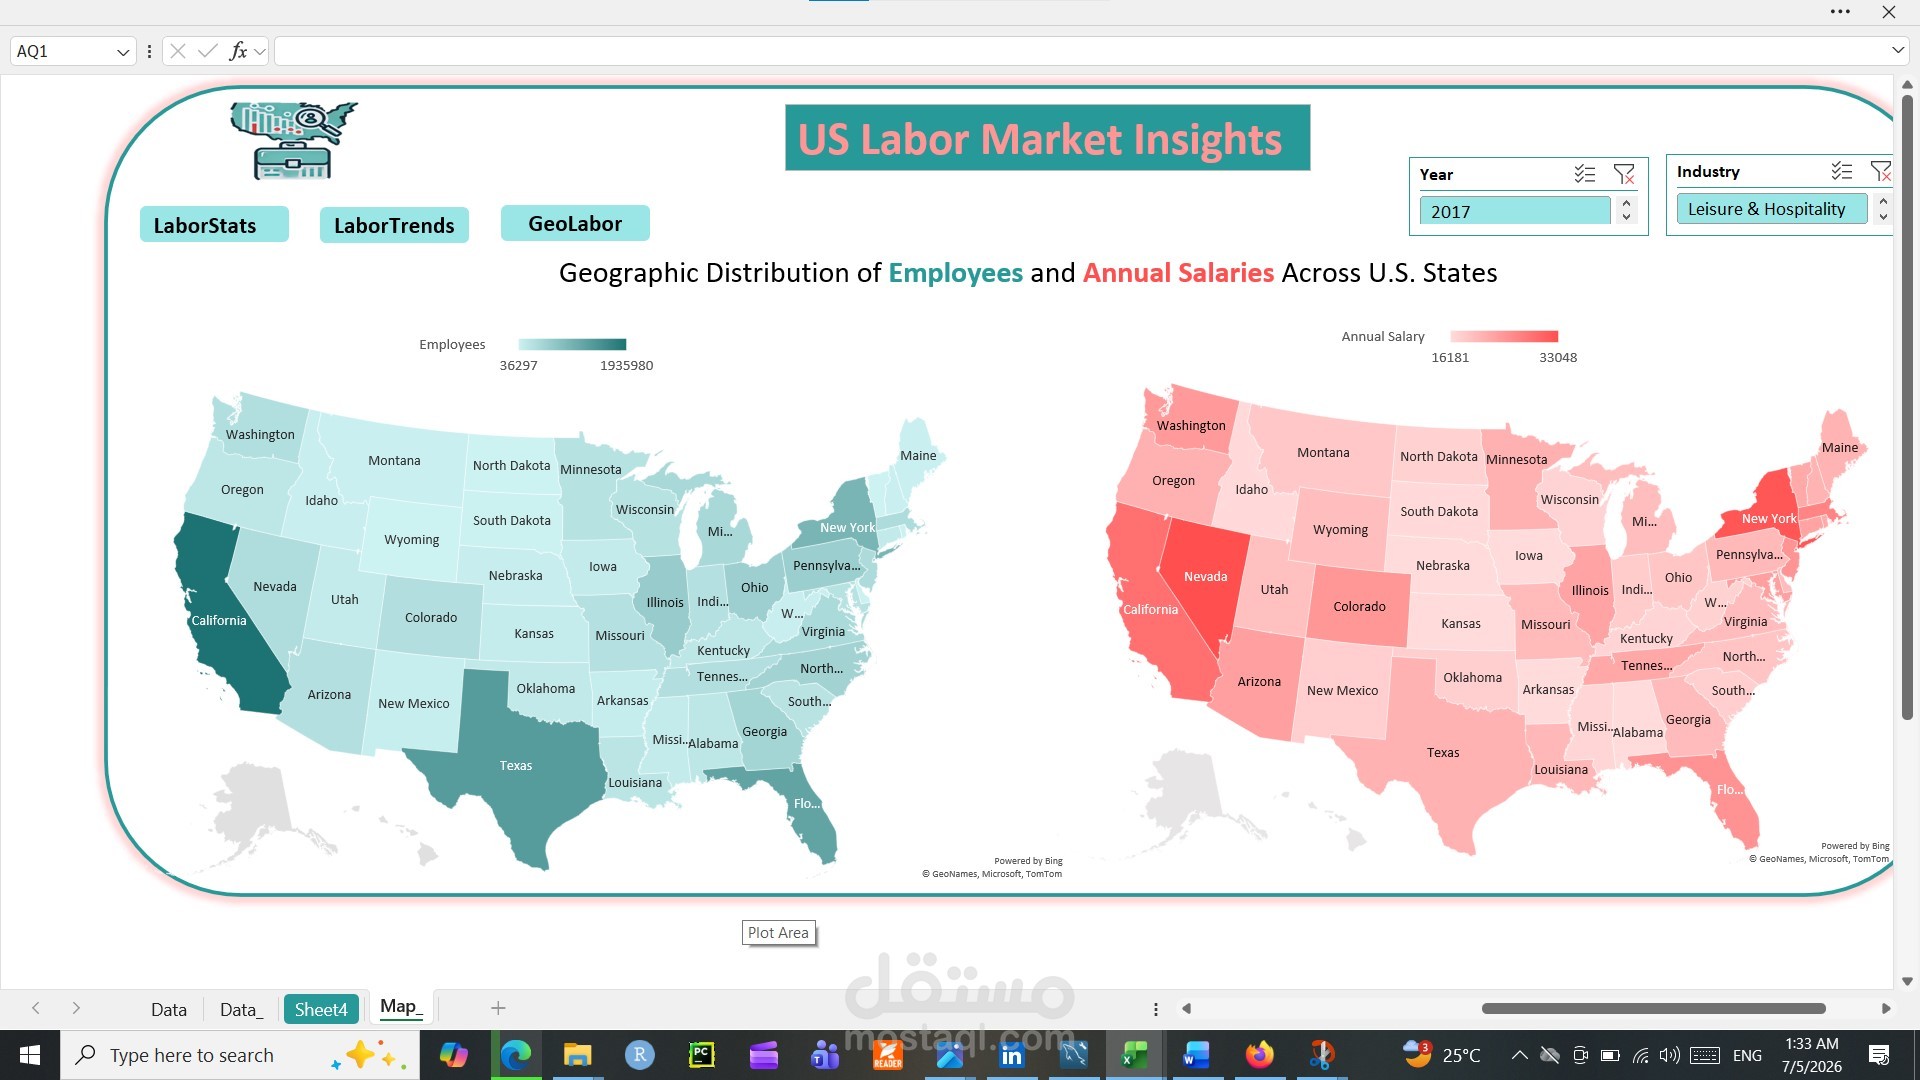
Employee Distribution by State: The left map shows where people work, with darker colors representing higher numbers of employees. California, Texas, and New York are some of the biggest employment hubs!
Average Salaries by State: The right map illustrates the average annual salaries across states. High wage levels in states like New York, California, and Nevada stand out.
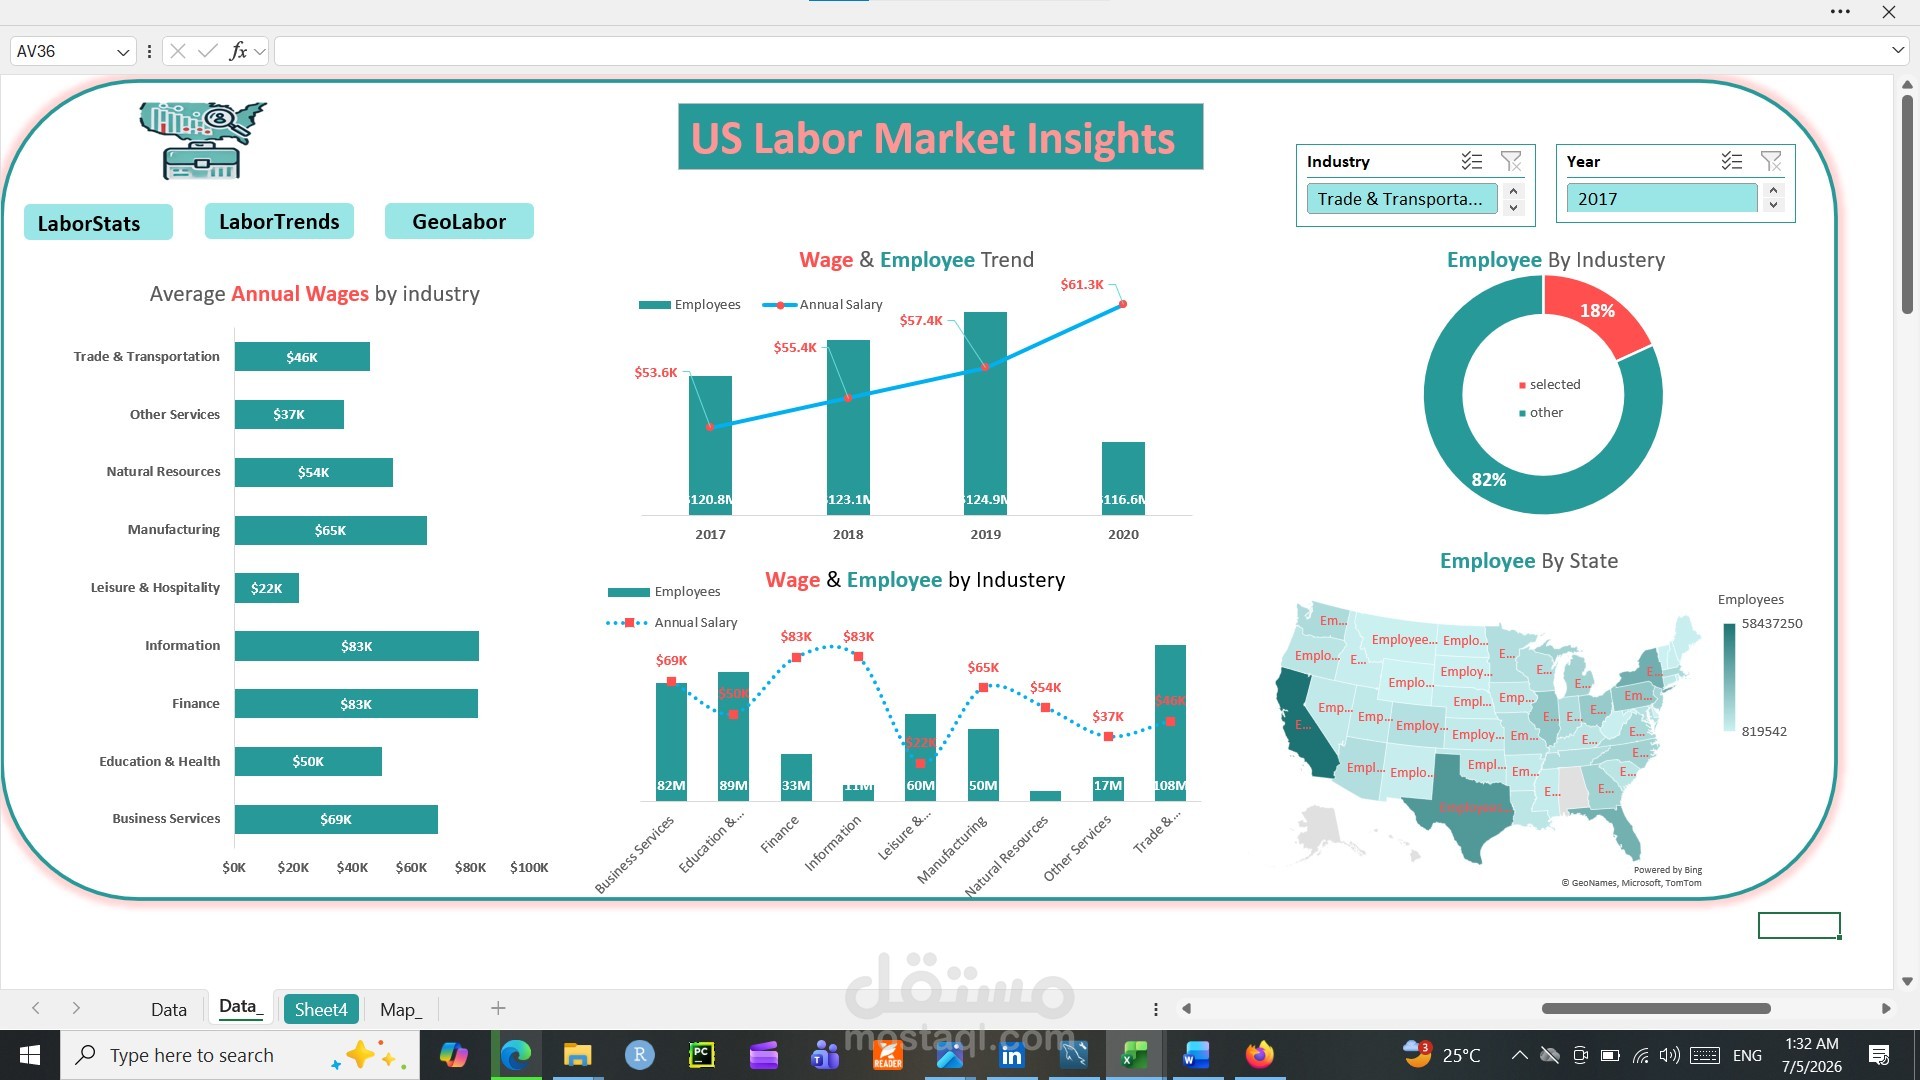
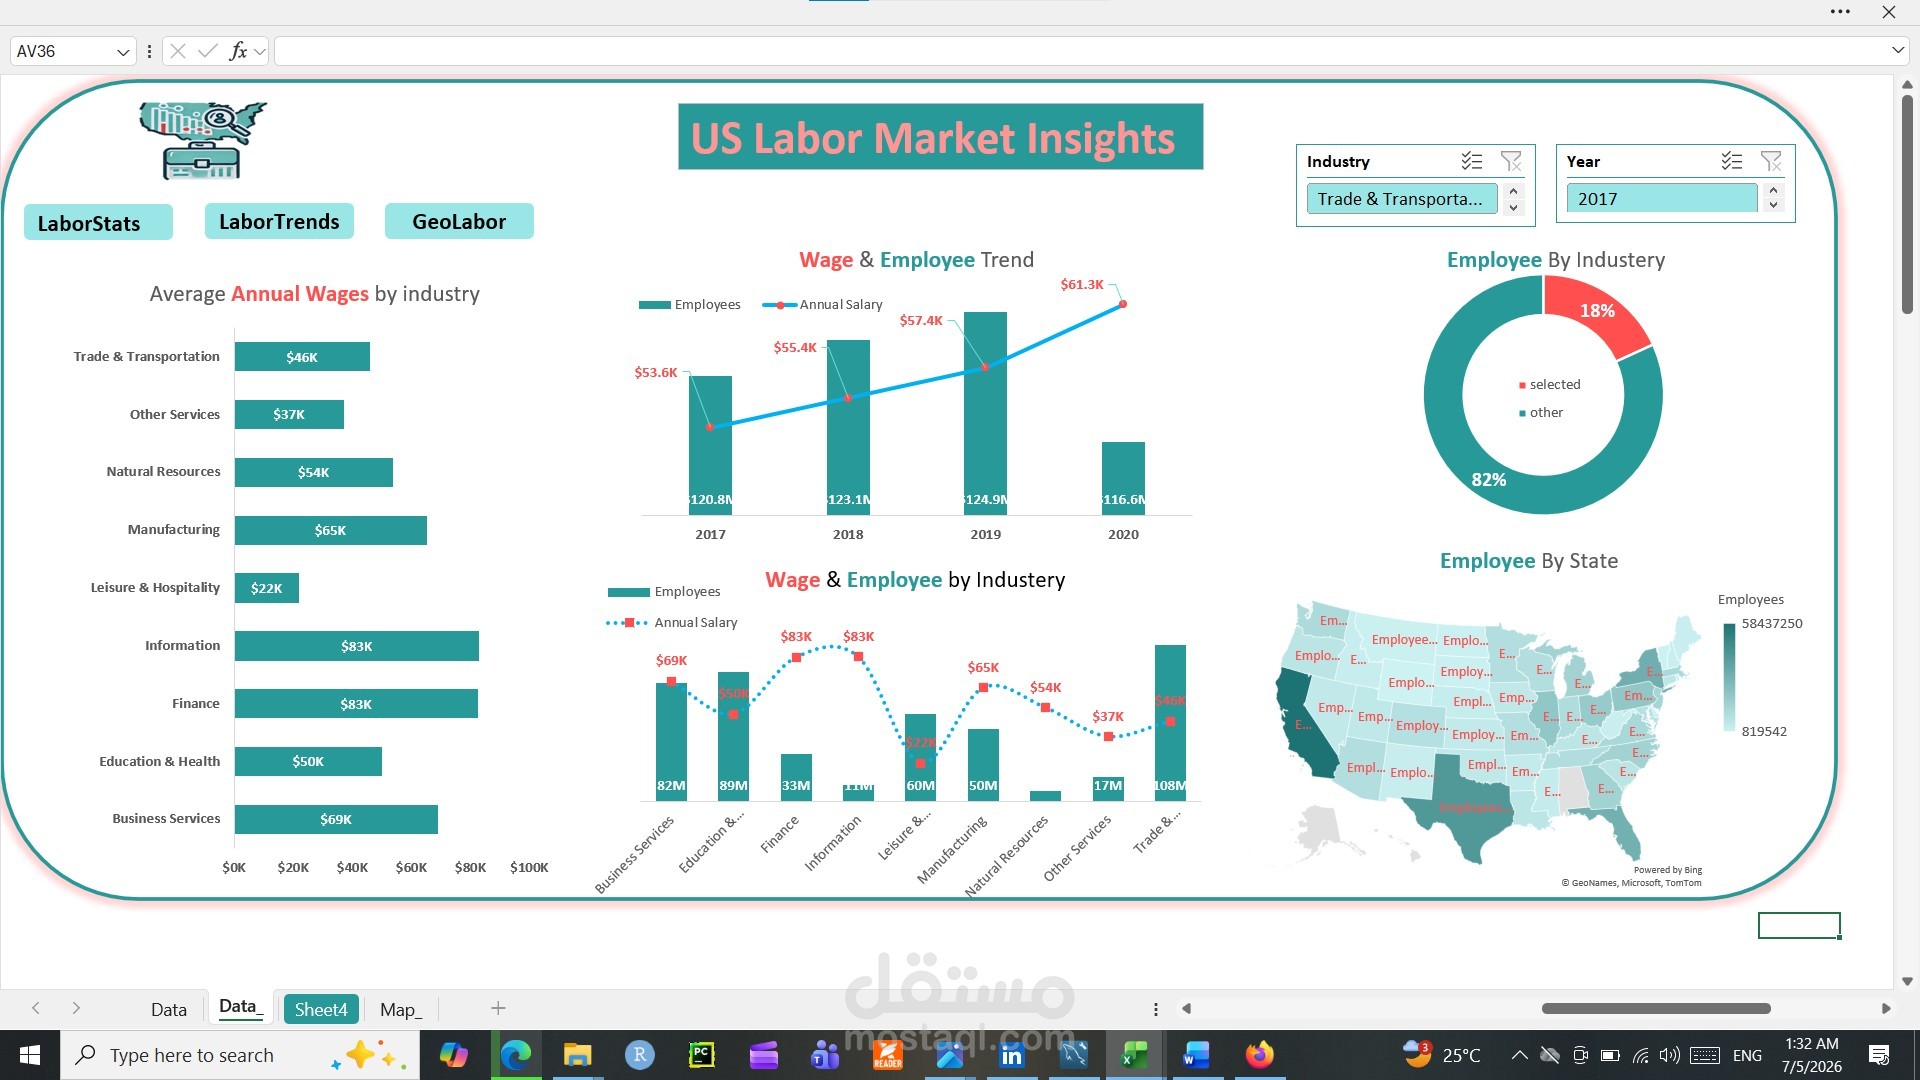
🔹 Industry Insights: The charts break down average wages by industry and show the number of employees. Finance, Information, and Manufacturing offer the highest average wages, while Leisure & Hospitality has lower pay levels.
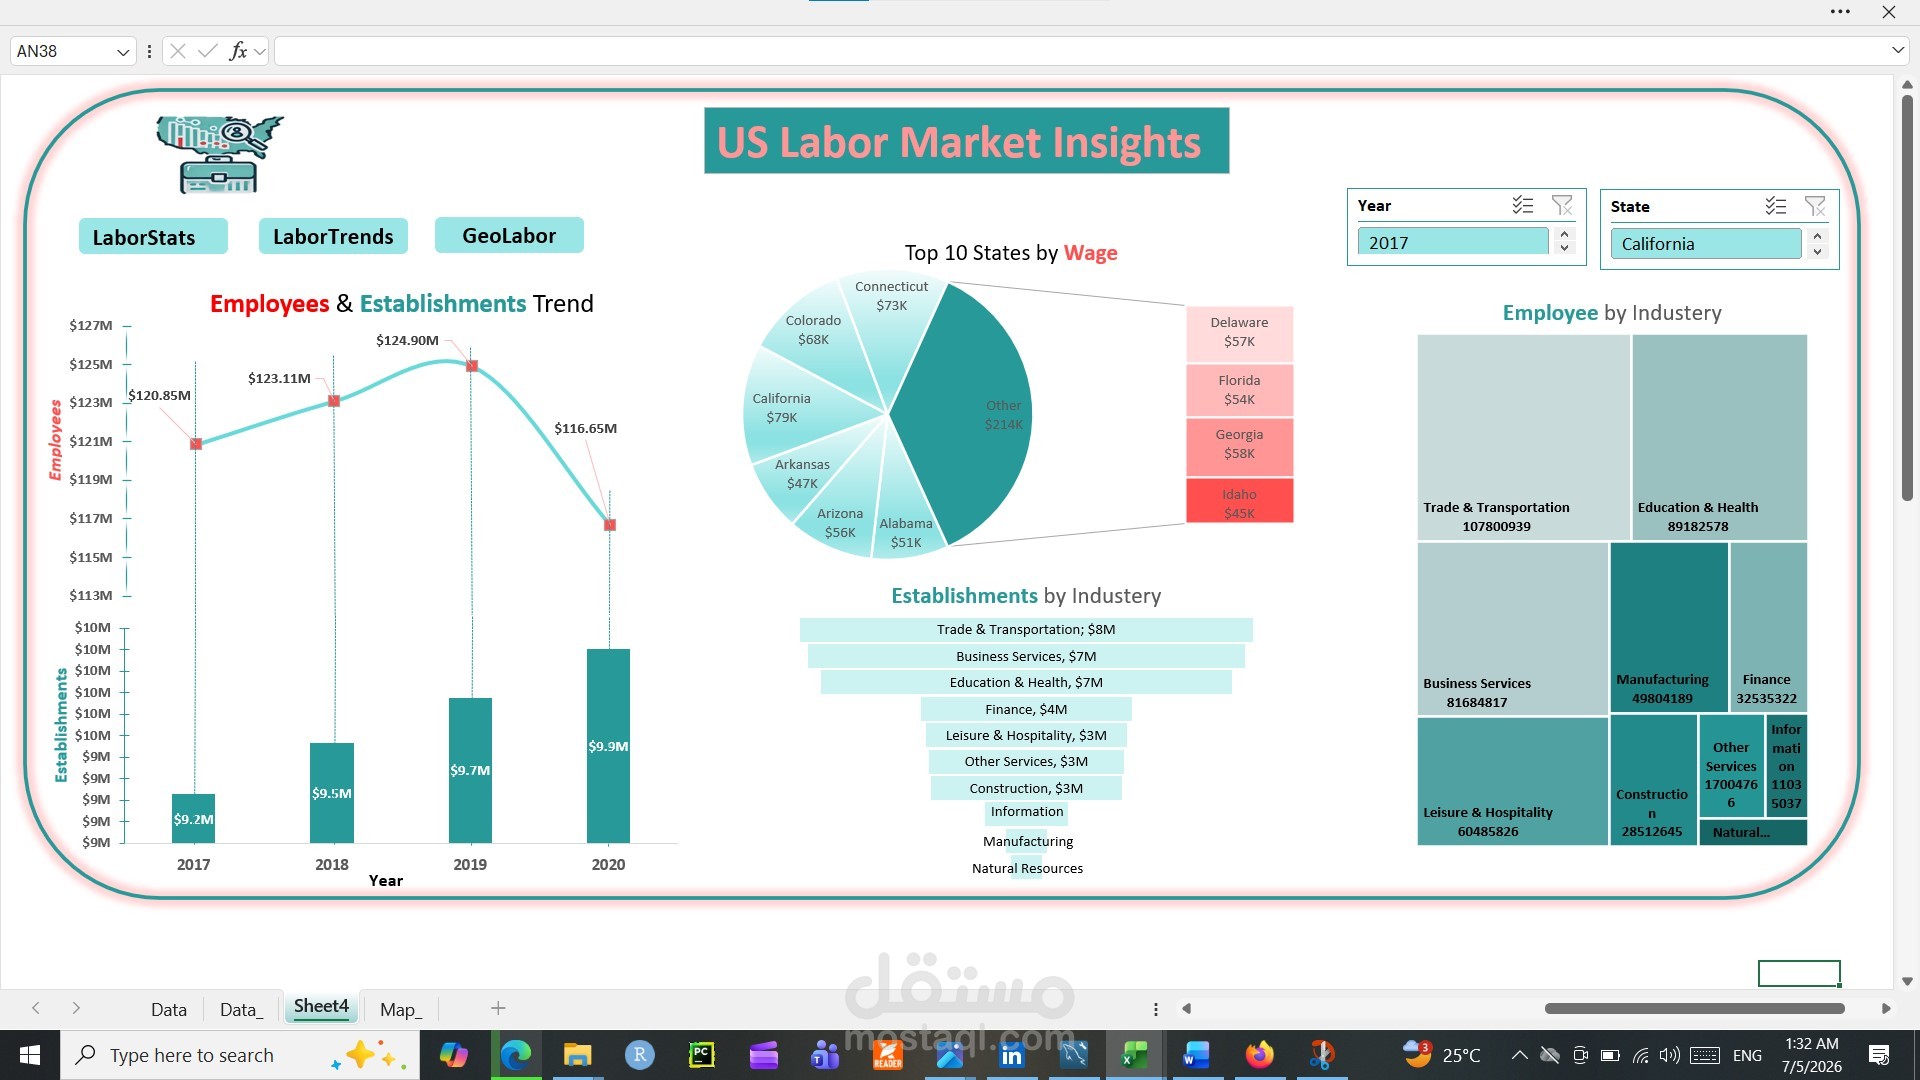
🔹 Trends Over Time: We can also see how employee numbers and salaries have shifted from 2017 to 2020, providing a snapshot of changing labor trends.