Dataanlysist
تفاصيل العمل
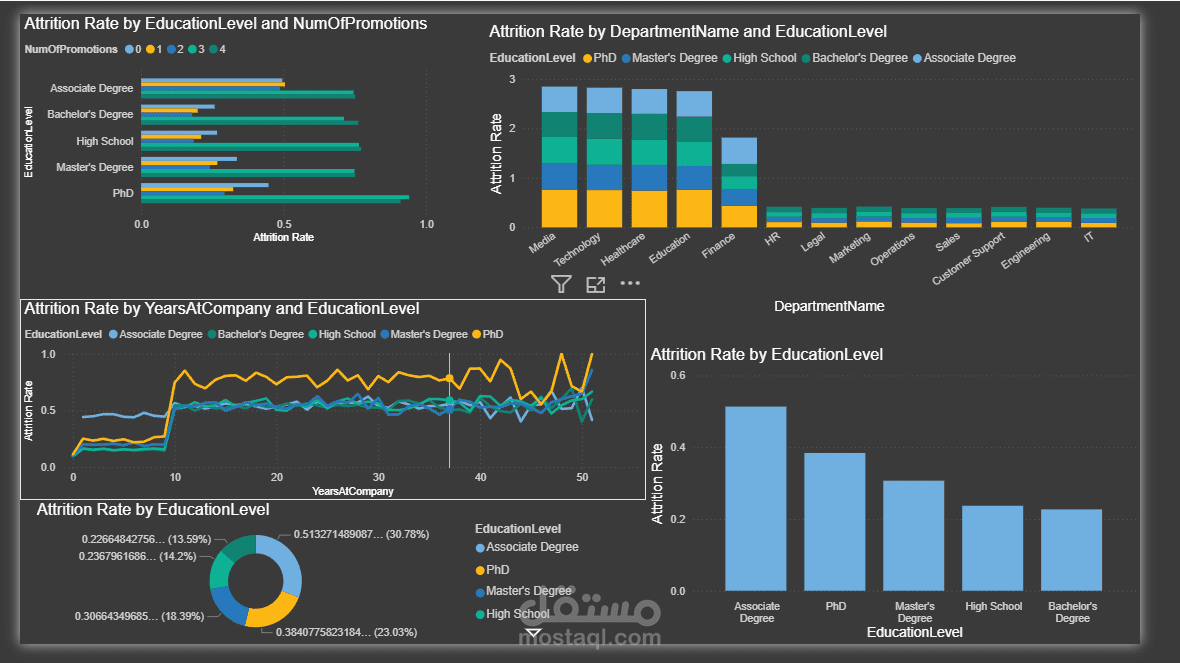
This project grew out of a straightforward but important question: why do employees leave? And more specifically, does who they are — how educated they are, how long they have been around, how well they perform — predict whether they will stay or go?
To answer that, we pulled together two complementary datasets from Kaggle. The first covers employee performance and productivity in detail — their job characteristics, working habits, education background, and satisfaction scores. The second is an attrition-focused dataset that tracks whether each employee eventually left, along with the demographic and work-related context behind that decision. Taken together, they give us a rich picture of the workforce.
We built a Star Schema in Power BI with a central FactAttrition table at its core, connected to four dimension tables: DimEmployee (capturing age, gender, overtime, and remote work), DimDepartment (the team or business unit), DimEducationLevel (the employee’s highest qualification), and DimTenure (years at the company and hire date). This design makes it straightforward to slice any metric — attrition rate, satisfaction score, promotion count — by any combination of those dimensions.
From that foundation, each team member explored a different angle: education and retention, promotion and career growth, performance and burnout, and salary fairness. What follows is the full account of what we found.
At a glance
Attrition Rate
71.84% Total Employees
174,497 High Risk Employees
8,168 Avg Income (Leavers)
$7.28K