Uber Business Analysis
تفاصيل العمل

Objective
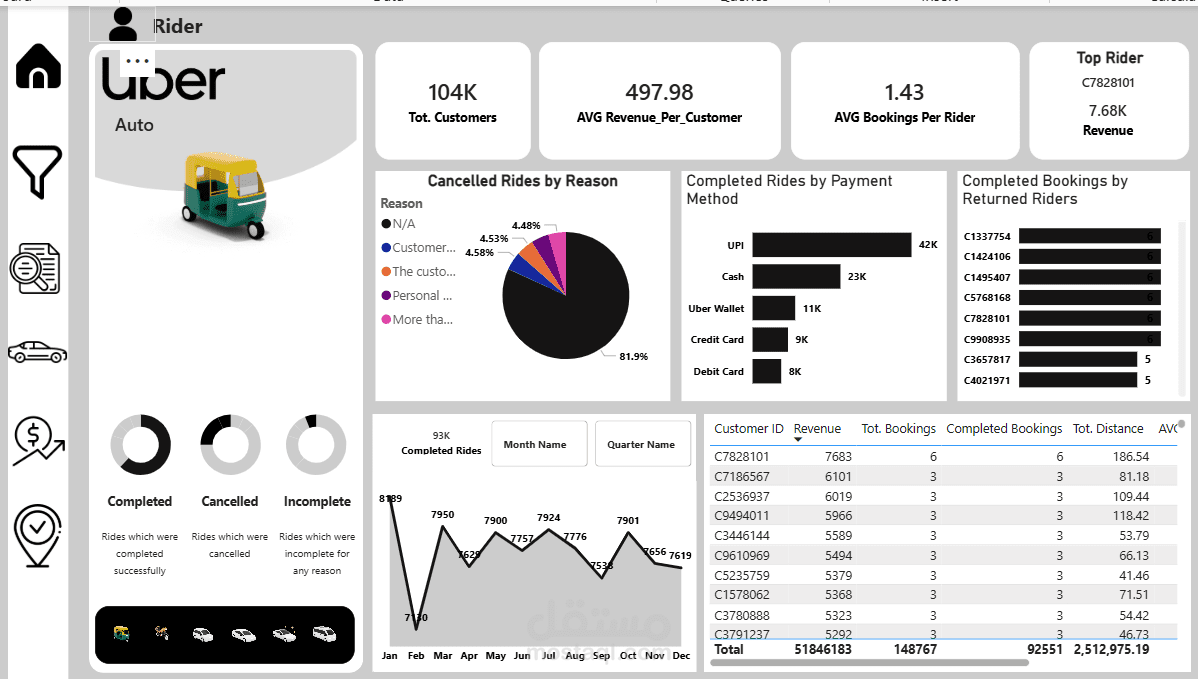
Transform raw bookings, customers, vehicles and revenue data into actionable insights.
Business Understanding
Problems:
Lost bookings, revenue tracking, rider/driver ratings.
Goals:
Improve booking completion rate
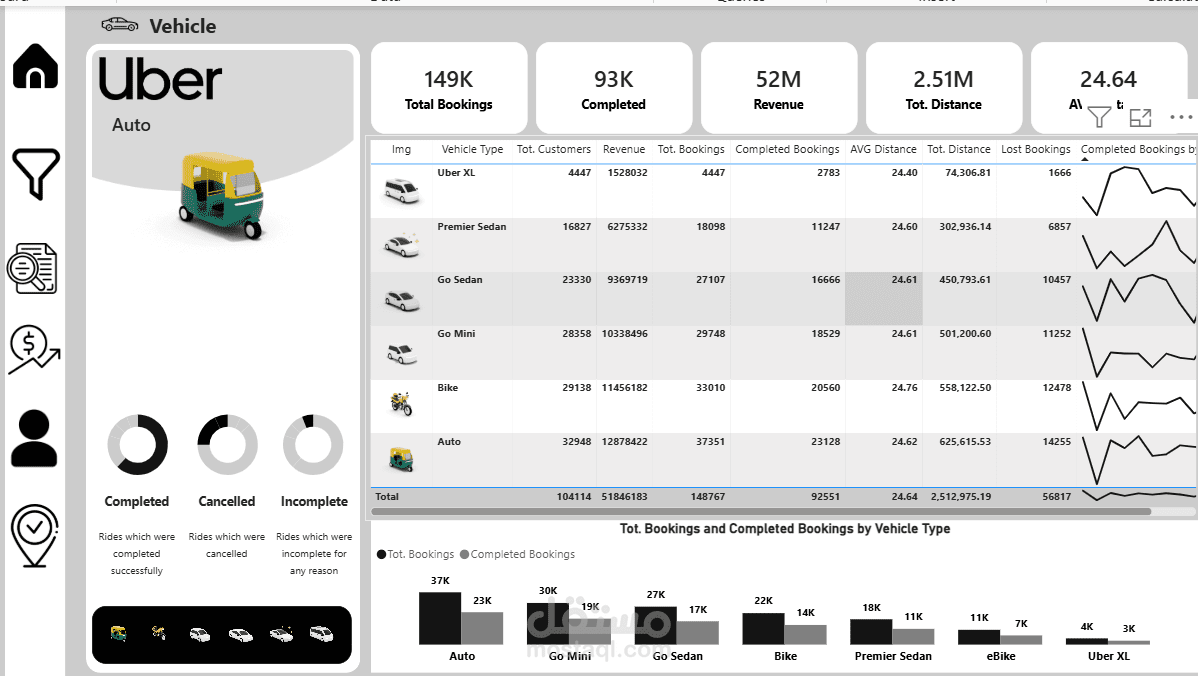
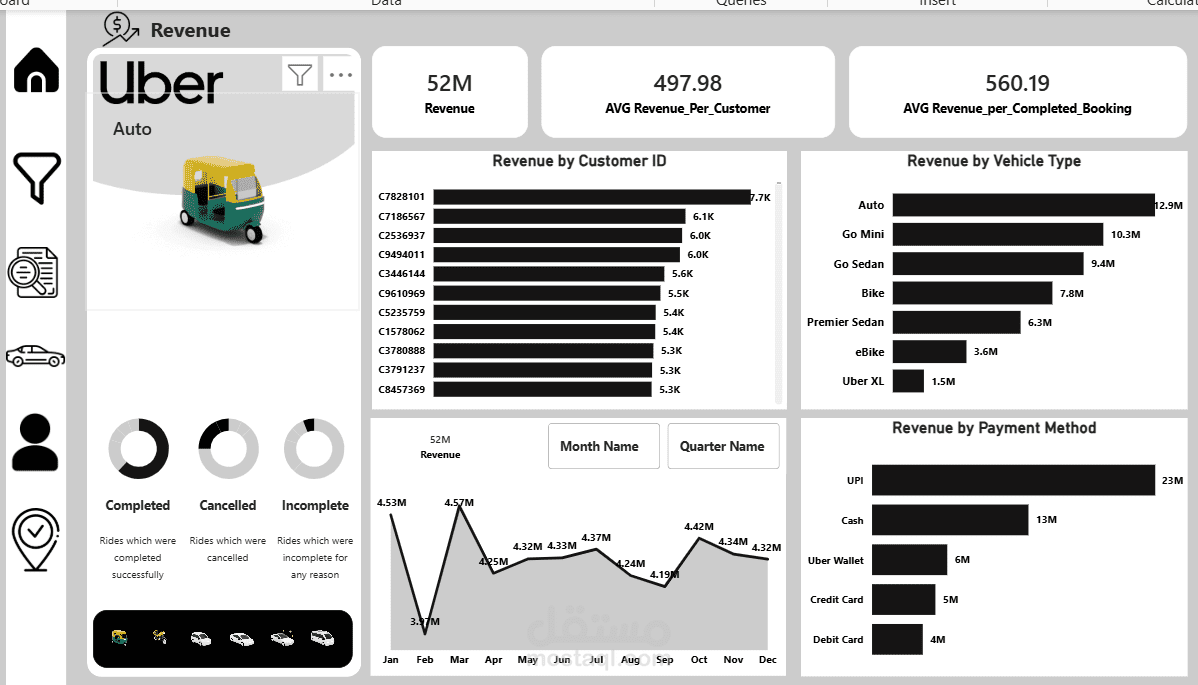
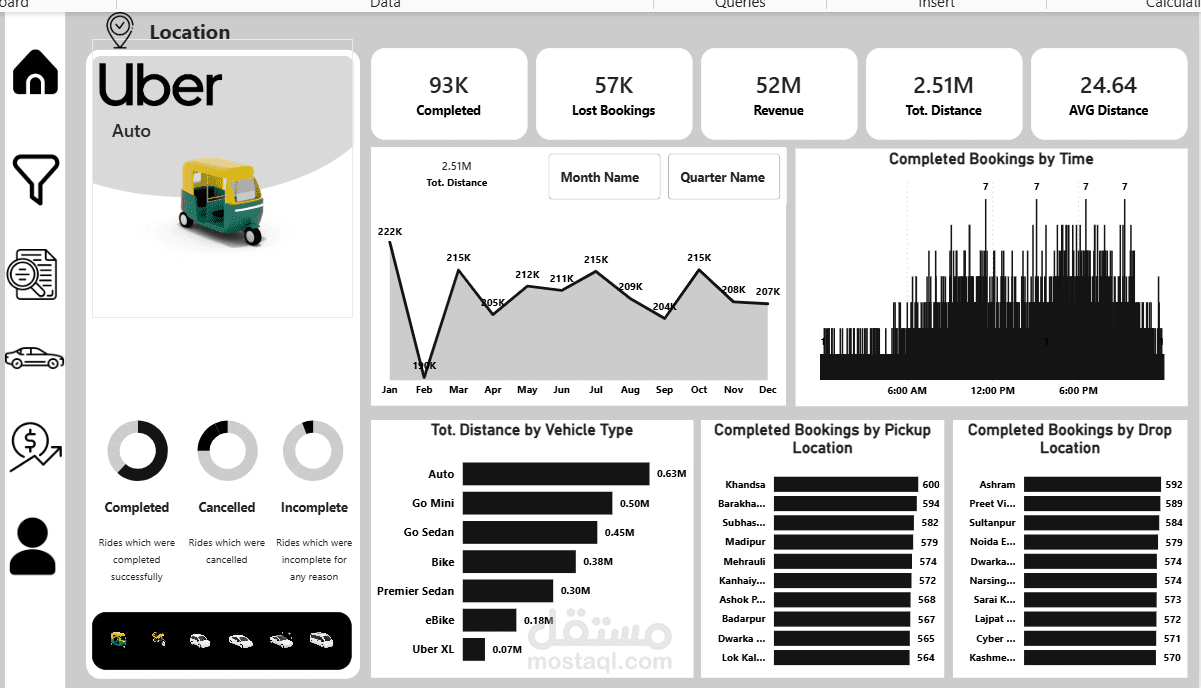
Optimize revenue by vehicle type & location
Enhance customer and driver satisfaction
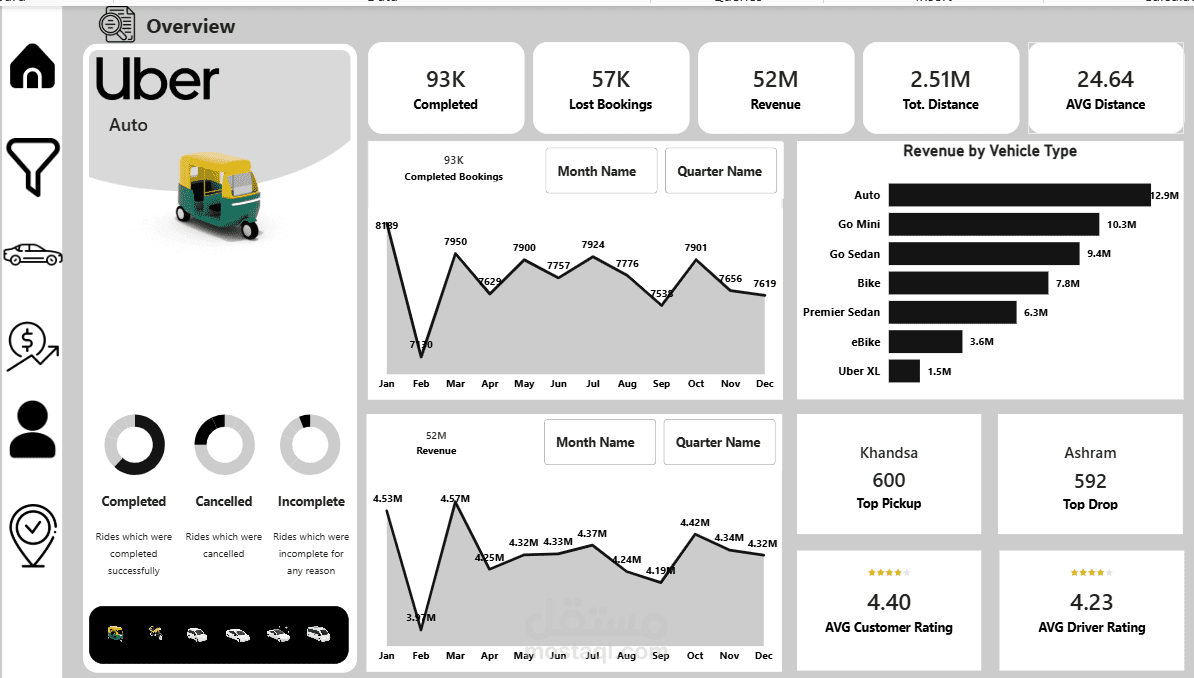
KPIs
Revenue, completed bookings, lost bookings, distances & ratings.
Data Preparation
1. Data transformation from excel to power query.
2. Data Cleaning (Power Query):
Check/remove duplicates
Removing nulls
Data format changes:
Time: from Date and time to (time),
Cancelled rides by customer/driver to (text “Yes and No”)
Booking value to (whole number)
Ride distance, driver/customer rating To (decimal number)
Data Modeling
Table Types
Dimension tables: IMG, Calendar
Fact table: Uber
Relationships:
IMG (Vehicle Type) ↔ Uber (Vehicle Type) , Relationship Type: [One to Many]
Calendar (Date) ↔ Uber (Date) , Relationship Type: [One to Many]
Recommendations
Apply discounts in Feb to generate more bookings
Push a marketing campaign focusing on Go Sedan vehicle types
Optimize vehicle allocation in busy times (From 4:00PM to 10:00 PM)