Retail Sales Analytics Dashboard (2022–2023)
تفاصيل العمل
Project Overview
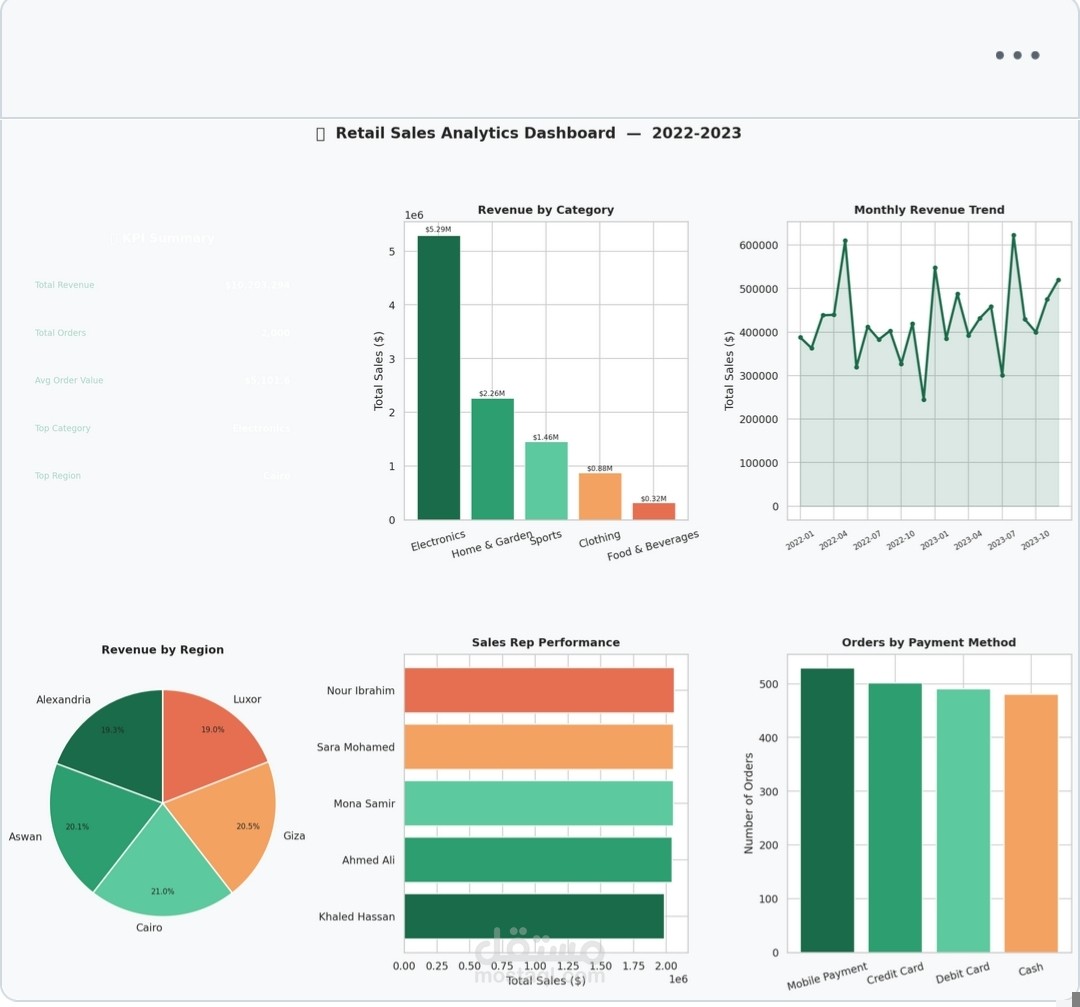
A full end-to-end Business & Sales Analytics project that simulates a real Egyptian retail company with 2,000 transactions over 2 years. The goal is to extract actionable insights from sales data using Python, SQL-style queries, and interactive visualizations.
🎯 Business Questions Answered
# Question
1 Which product category generates the most revenue?
2 What is the monthly revenue trend over 2 years?
3 Which region has the highest sales volume?
4 Who is the top-performing sales representative?
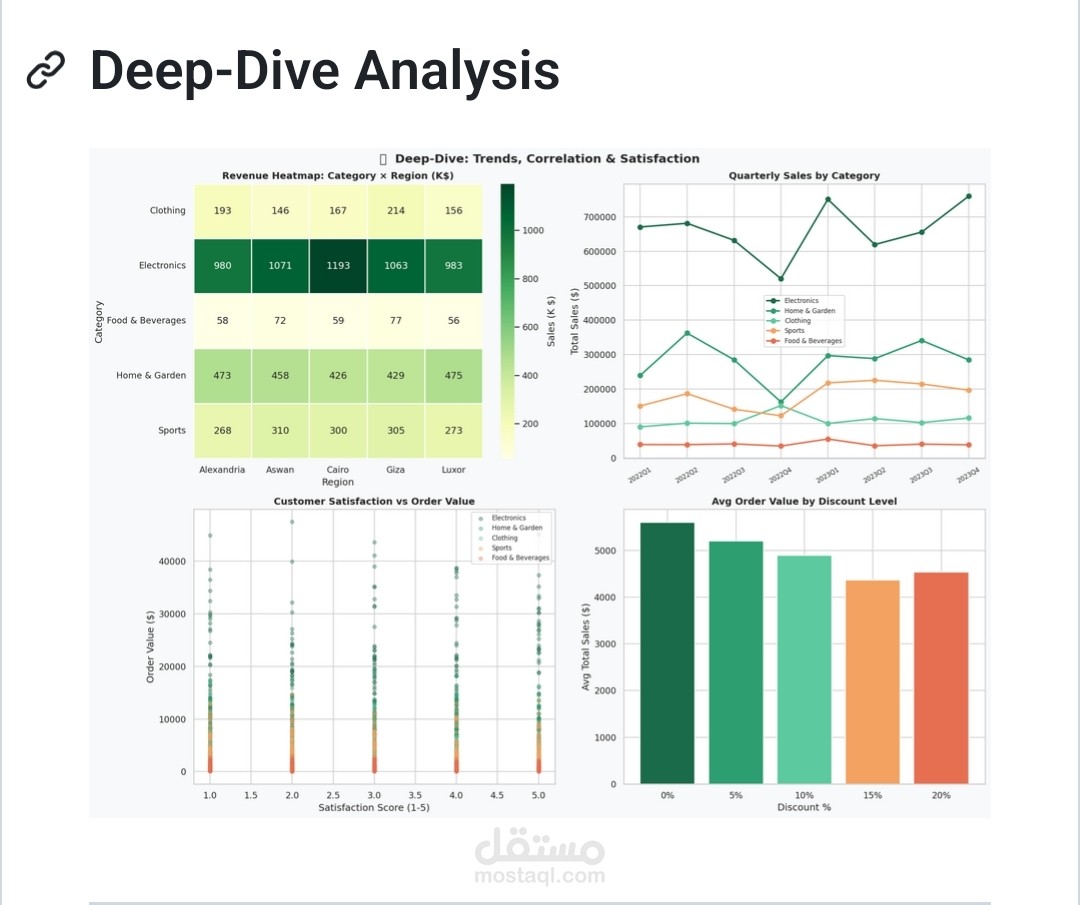
5 How does discount level affect average order value?
6 What is the most popular payment method?
7 What is the quarterly revenue trend per category?
8 How does customer satisfaction correlate with order value?
📊 Dashboard Preview
Overview Dashboard
Dashboard Overview
Deep-Dive Analysis
Deep Dive
📁 Project Structure
Retail-Sales-Analytics/
│
├── 📄 sales_data.csv # Raw dataset (2,000 transactions)
├── 🐍 generate_data.py # Data generation script
├── 🐍 analysis.py # Full EDA + SQL-style analysis
├── 📊 dashboard_overview.png # Main KPI dashboard
├── 📊 deep_dive_analysis.png # Correlation & trend analysis
├── 📋 analysis_summary.xlsx # Excel report (3 sheets)
└── 📖 README.md
📦 Dataset Description
Column Type Description
Order_ID String Unique order identifier
Date Date Transaction date (2022–2023)
Category String Product category (5 categories)
Region String Egyptian city
Sales_Rep String Representative name
Quantity Integer Units sold
Unit_Price Float Price per unit ($)
Discount Float Discount applied (0–20%)
Total_Sales Float Net revenue after discount
Payment_Method String Payment type
Customer_Age Integer Customer age
Customer_Satisfaction Integer Rating 1–5
🔍 Key Findings
💰 Electronics is the highest-revenue category (~30% of total sales)
📈 Revenue shows a positive growth trend in Q4 2023
🗺️ Cairo leads in total regional revenue
👤 Nour Ibrahim is the top sales representative ($2.06M)
💳 Credit Card is the most preferred payment method
🏷️ Orders with 10–15% discount show the highest average order value
😊 Customer satisfaction score doesn't strongly predict order size — suggesting pricing is needs-driven
🛠️ Technologies Used
pandas # Data manipulation & SQL-style queries
numpy # Numerical operations
matplotlib # Custom charts & dashboards
seaborn # Statistical visualizations
openpyxl # Excel report export