MIMIC-III Dataset - Exploratory Data Analysis (EDA)
تفاصيل العمل
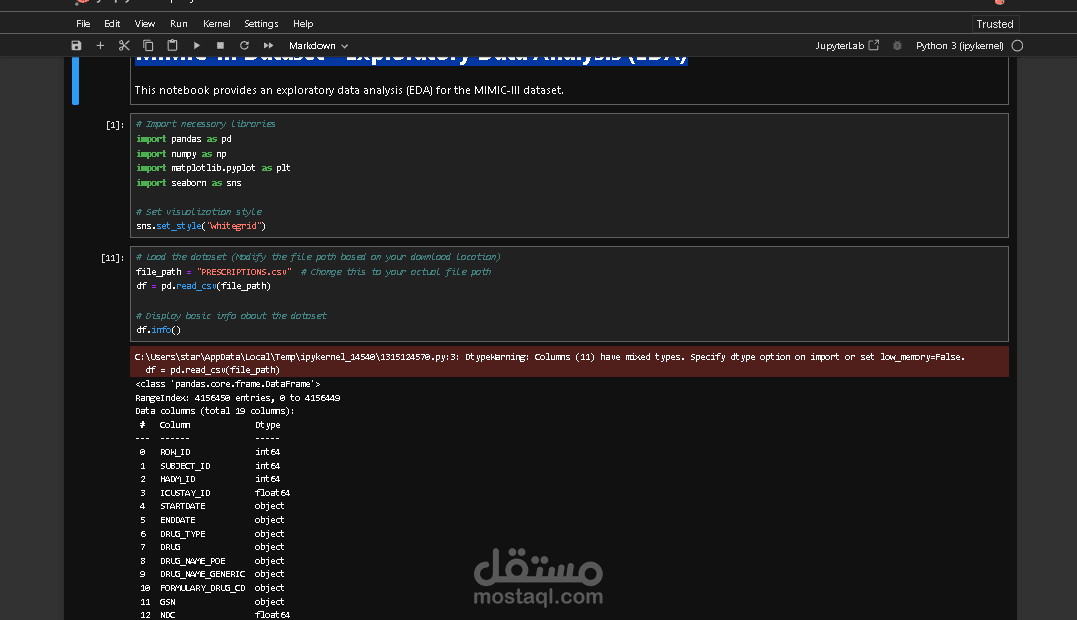
This notebook performs Exploratory Data Analysis (EDA) on the MIMIC-III Prescriptions Dataset, which contains medication and prescription-related healthcare data.
The main tasks completed in the notebook include:
Importing essential data analysis and visualization libraries such as Pandas, NumPy, Matplotlib, and Seaborn.
Loading the PRESCRIPTIONS.csv dataset and examining its structure.
Displaying dataset information, including the number of records, columns, and data types.
Previewing the first few rows to understand the dataset contents.
Identifying and reporting missing values across the dataset.
Generating descriptive statistics to summarize numerical features.
Creating a correlation heatmap to explore relationships between numerical variables.
Visualizing feature distributions using histograms.
Detecting potential outliers through boxplots.
Saving the processed dataset for future analysis.
Outcome
The notebook provides an initial understanding of the MIMIC-III prescription data by exploring its structure, quality, distributions, correlations, and potential anomalies. This EDA serves as a foundation for further healthcare analytics, predictive modeling, and machine learning applications.