data analysis
تفاصيل العمل
What Is This?
This is a Tableau-based data visualization project exploring the data science job market. Rather than a written report, all the content lives in interactive charts and dashboards built in Tableau, with the slides being screenshots of those visualizations. The dataset used is data_science_job.csv, covering attributes like job titles, salaries, company locations, employment types, experience levels, and work settings.
The Visualizations
Six individual charts were created, then combined into two dashboards:
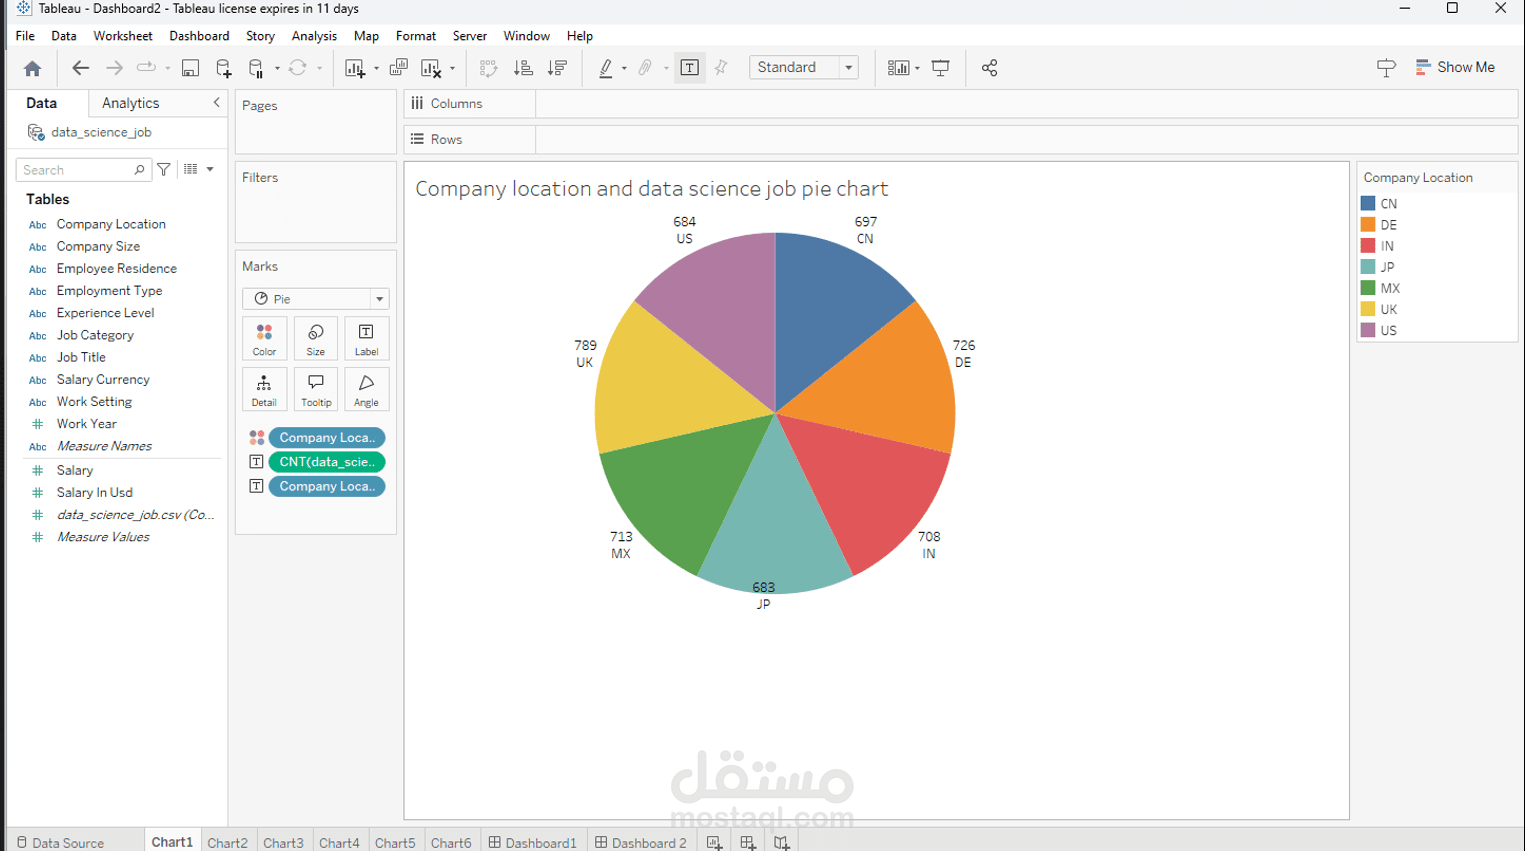
Chart 1 — Company Location (Pie Chart)
Shows the distribution of data science jobs across 7 countries. The UK leads with 789 jobs, followed closely by China (697), Germany (726), India (708), Mexico (713), Japan (683), and the US (684). Remarkably even spread across all countries.
Chart 2 — Job Title & Salary (Horizontal Bar Chart)
Compares total salaries across different job roles and work settings (remote, in-office, hybrid). Data Engineers and Statisticians appear to earn among the highest total salaries, while Machine Learning Engineers and Data Scientists also rank high.
Chart 3 — Work Setting Over Time (Area Chart)
Tracks how Hybrid, In-Person, and Remote work arrangements evolved from 2020 to 2023. All three settings show a clear growth in job count, with 2022 being a peak year. In-person had notably ~585 jobs in 2020 alone.
Chart 4 — Employment Type, Job Category & Salary (Side-by-Side Bars)
Breaks down salaries by employment type (Contract, Freelance, Full-Time, Part-Time) and job category (Analysis, Data Science, Engineering, ML/AI). Full-time roles dominate in raw salary totals, and ML/AI consistently commands strong compensation across all employment types.
Chart 5 — Experience Level & Salary (Bullet Graph)
Compares job count and salary ranges across experience levels: Entry (EN), Mid (MI), Senior (SE), and Executive (EX). Senior and Executive roles clearly extend furthest in both count and pay.
Chart 6 — Salary Currency vs. Job Title (Circle/Dot Chart)
A dot matrix showing how salaries are distributed across different currencies (EUR, GBP, INR, JPY, USD) for each job title and work setting. Useful for spotting which roles and currencies carry the highest individual salaries.