Sales Performance Dashboard
تفاصيل العمل


1. Core KPIs (Key Performance Indicators)
At the top of the main dashboard pages (DB1, DB2, DB3), there is a consistent header displaying the most critical business metrics:
Total Sales: 1.35 Million
Net Sales: 1.27 Million
Max Sales: 15.81K (Highest single transaction)
Min Sales: 4.80 (Lowest single transaction)
Sales AVE: 628.52 (Average transaction value)
# Of Trans: 2155 (Total number of transactions)
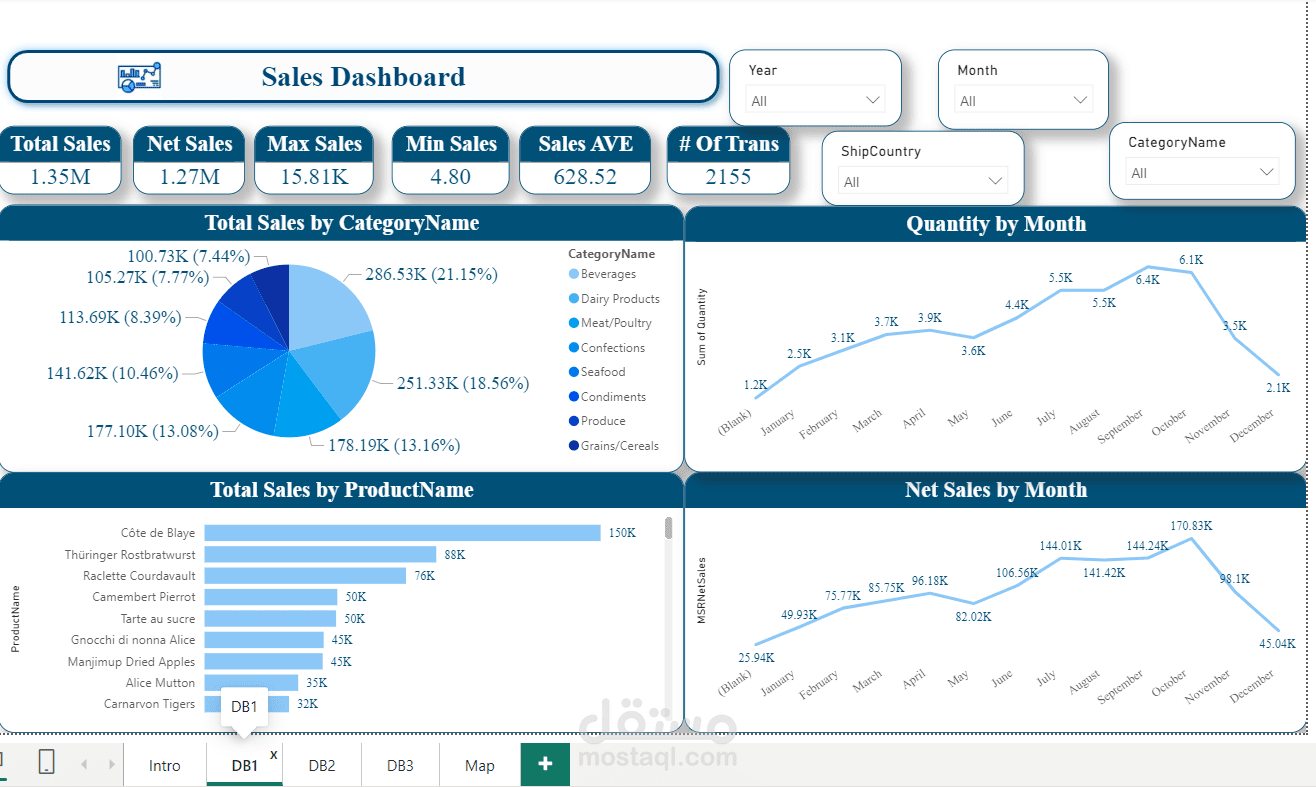
2. DB1: Sales Overview & Trends
This page focuses on what is being sold and when.
Total Sales by CategoryName (Pie Chart): Shows the revenue share of different product categories. Beverages lead the sales with 21.15% (286.53K), followed closely by Dairy Products (18.56%).
Total Sales by ProductName (Bar Chart): Highlights the top-performing individual items. "Côte de Blaye" is the undisputed best-seller at 150K.
Quantity & Net Sales by Month (Line Charts): These charts track performance over the year. Both sales and quantities show an upward trend throughout the year, peaking sharply in October (170.83K in Net Sales) before dropping off in November and December.
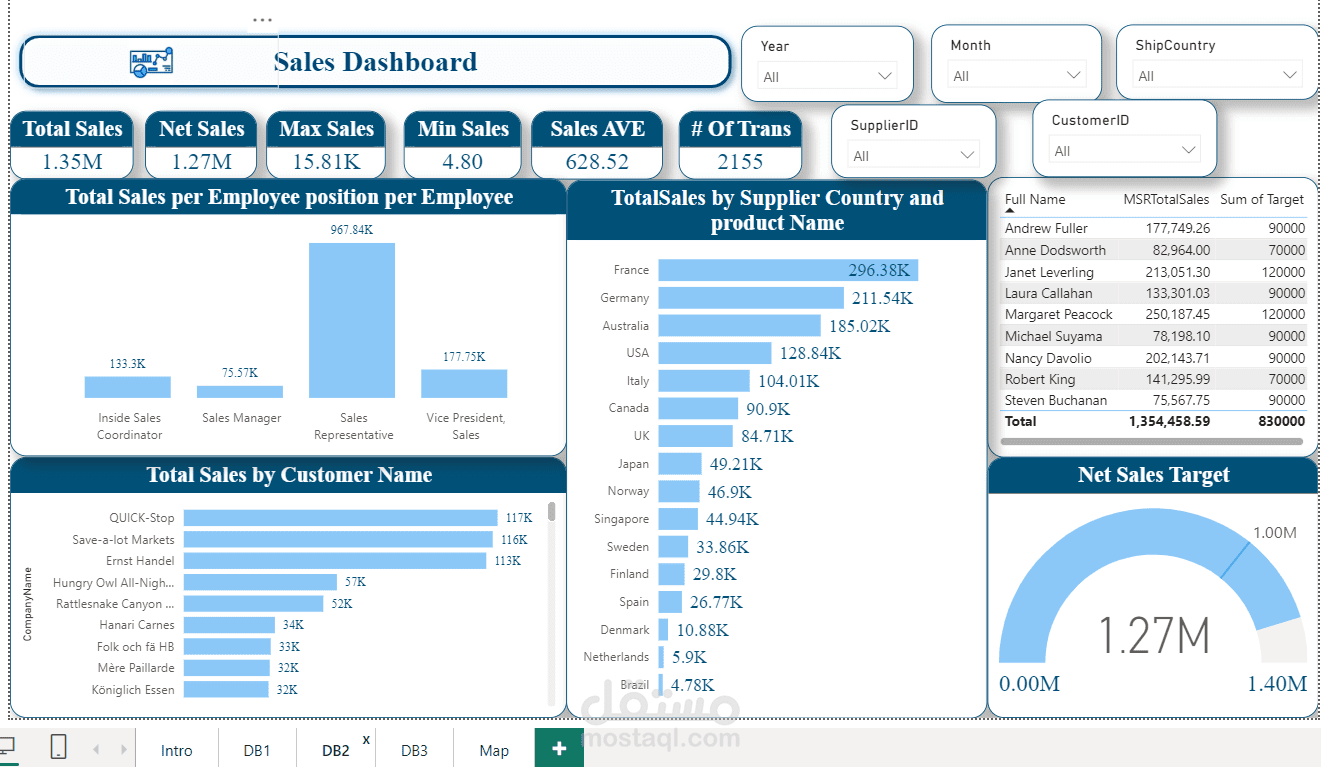
3. DB2: Employee, Customer, & Supplier Performance
This page evaluates who is driving the business (both internally and externally).
Total Sales per Employee Position (Column Chart): Clearly shows that Sales Representatives generate the vast majority of the revenue (967.84K), far outpacing Sales Managers and Vice Presidents.
Total Sales by Customer Name (Bar Chart): Identifies top clients. "QUICK-Stop", "Save-a-lot Markets", and "Ernst Handel" are the most valuable B2B customers, each bringing in over 110K.
Total Sales by Supplier Country (Bar Chart): Shows the origin of the best-selling goods. France (296.38K) and Germany (211.54K) are the top suppliers.
Net Sales Target (Gauge Chart): Displays current Net Sales (1.27M) against a goal of 1.40M, showing the team is close but slightly short of the target.
Employee Table: A detailed breakdown comparing individual salespeople against their specific sales targets.
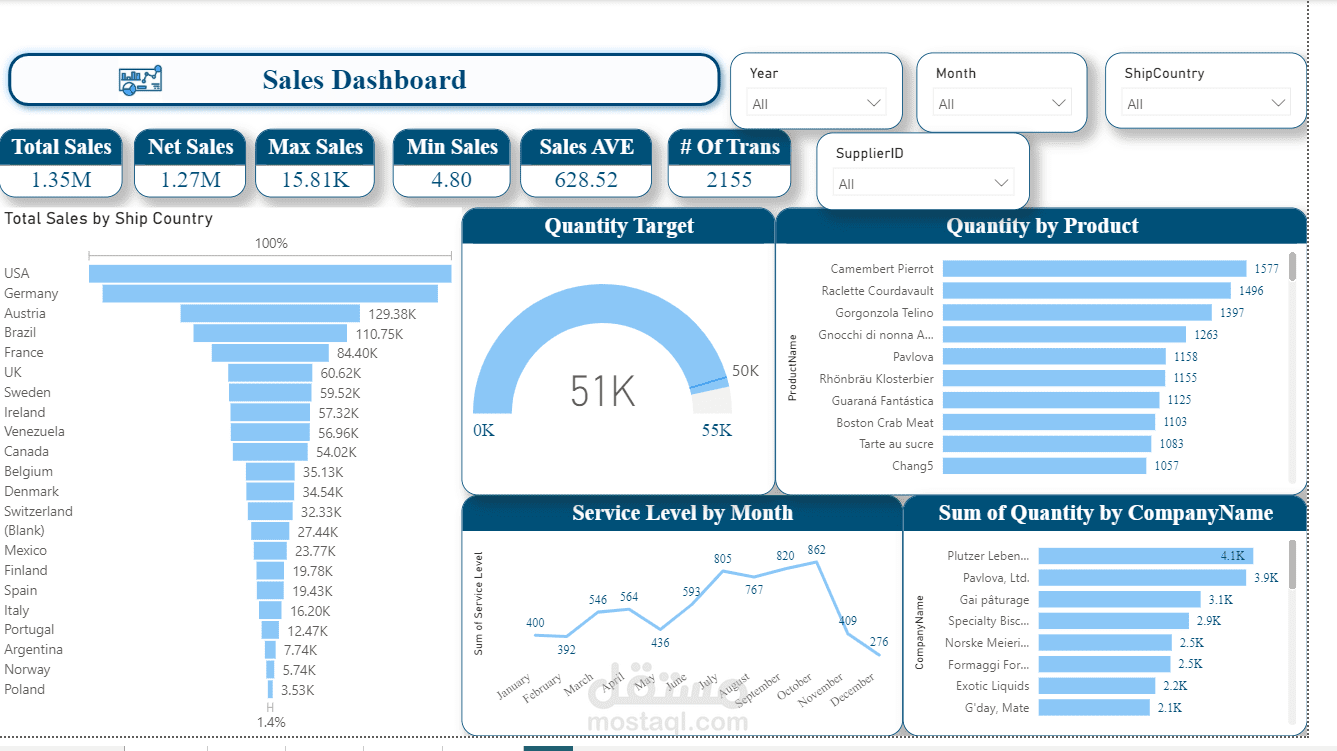
4. DB3: Logistics, Shipping, & Volume Details
This page analyzes where products are going and the volume of goods moved.
Total Sales by Ship Country (Funnel/Bar Chart): The USA is the primary market, bringing in 129.38K, followed by Germany and Austria.
Quantity Target (Gauge Chart): Tracks the volume of items sold. The company has moved 51K units against a target of 55K.
Quantity by Product & CompanyName: Similar to DB1 and DB2, but focused strictly on the number of items moved rather than their monetary value. "Camembert Pierrot" is the most frequently sold item by volume (1577 units).
Service Level by Month (Line Chart): Tracks operational efficiency, which peaks in November (862) right after the massive sales spike in October.
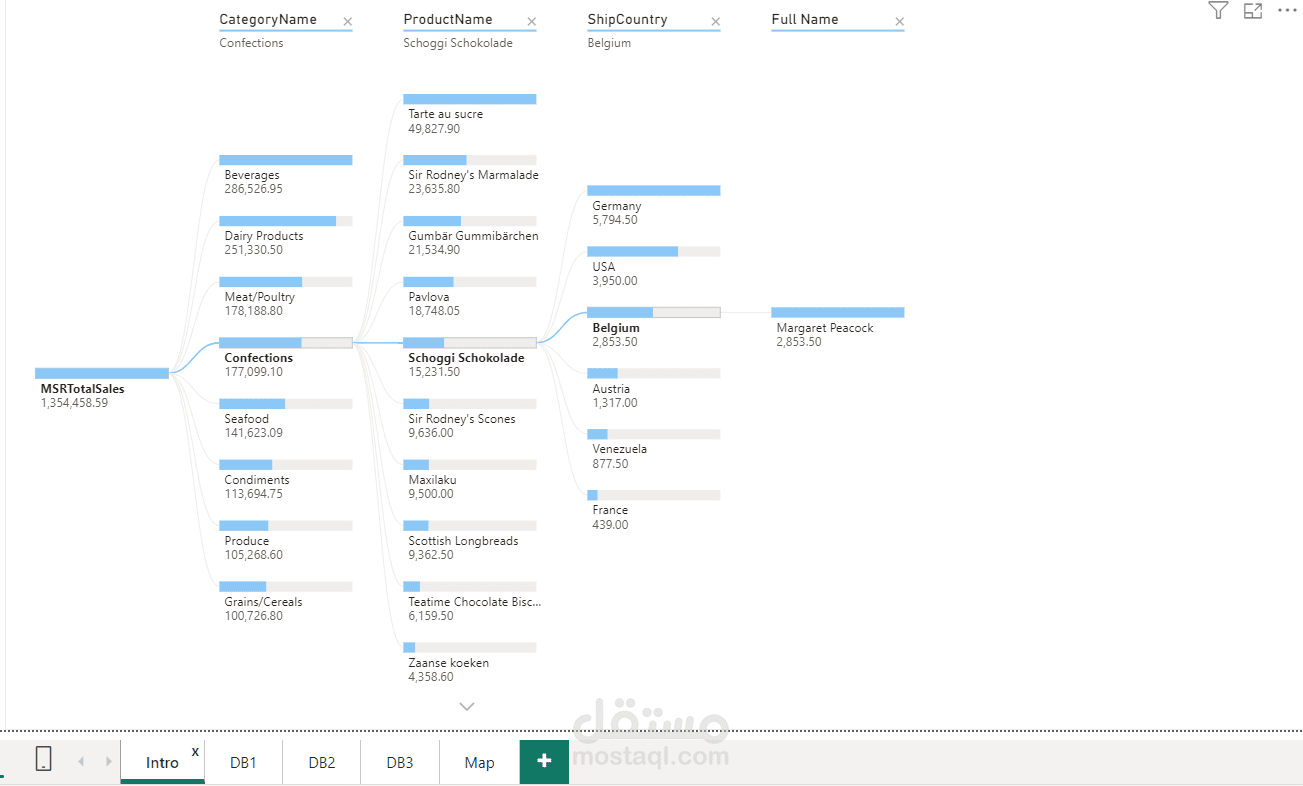
5. Decomposition Tree Tab
This is an interactive root-cause analysis visual. It breaks down the overarching MSRTotalSales (1.35M) step-by-step into granular details. In the screenshot, the user has drilled down into:
Confections (Category)
Schoggi Schokolade (Specific Product)
Belgium (Ship Country)
Margaret Peacock (The specific employee who made those sales).
This is incredibly useful for finding exactly where specific revenues originated.
6. Map Tab
A geographical heat map plotting the sum of quantity and total sales across the globe. The visual highlights heavy market concentration in North America and Western Europe, with smaller, emerging footprints in South America (like Brazil).