Revenue & Expense Analysis Dashboard – Logistics Services Company
تفاصيل العمل
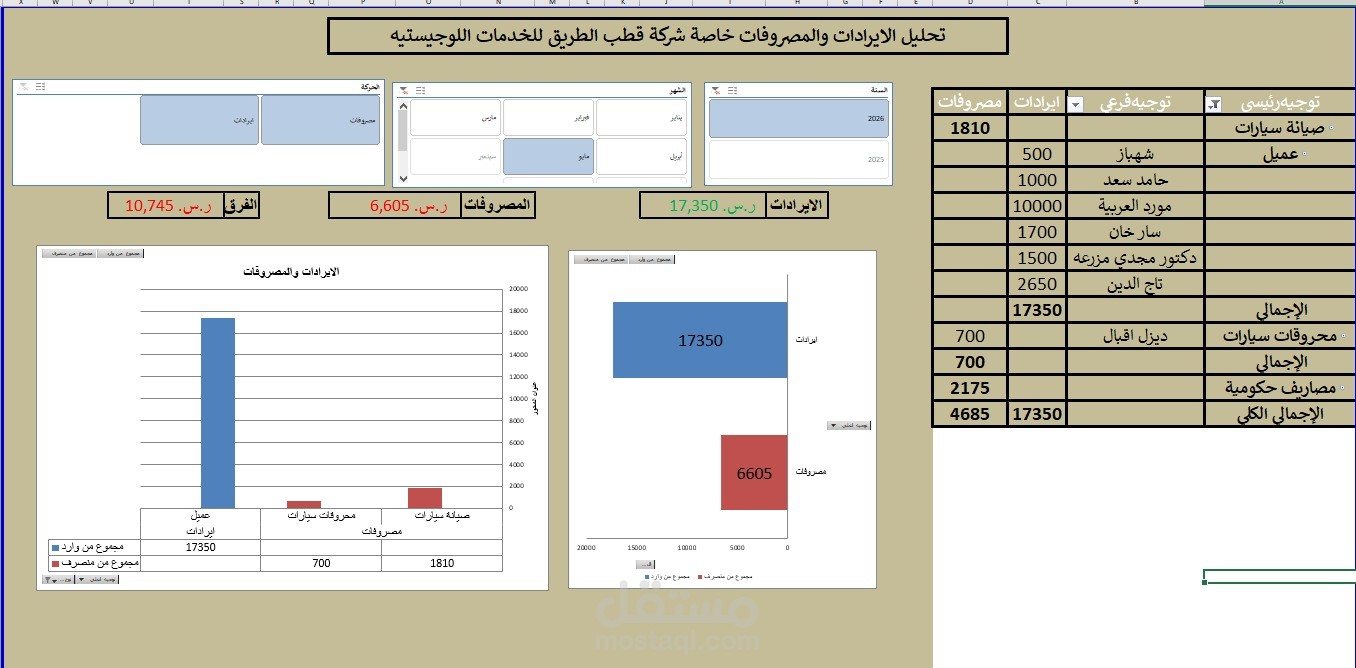

Created a professional Excel dashboard to analyze revenues and expenses for a logistics services company.
The dashboard provides a clear financial overview and helps track operational costs and income sources efficiently.
Project Features:
Analyzing total revenues, expenses, and net difference
Categorizing expenses such as vehicle maintenance, fuel costs, and government expenses
Monitoring client payments and revenue sources
Designing interactive charts and financial summaries
Creating a dynamic dashboard using Pivot Tables and Excel visualization tools
Improving financial tracking and supporting better business decisions
Tools & Skills Used:
Microsoft Excel
Pivot Tables & Pivot Charts
Financial Data Analysis
Dashboard Design
Data Visualization & Reporting**