Skincare and Beauty E-Commerce Analysis
تفاصيل العمل
E-Commerce Sales & Profitability Analysis (Skincare & Beauty Industry)
? Project Overview
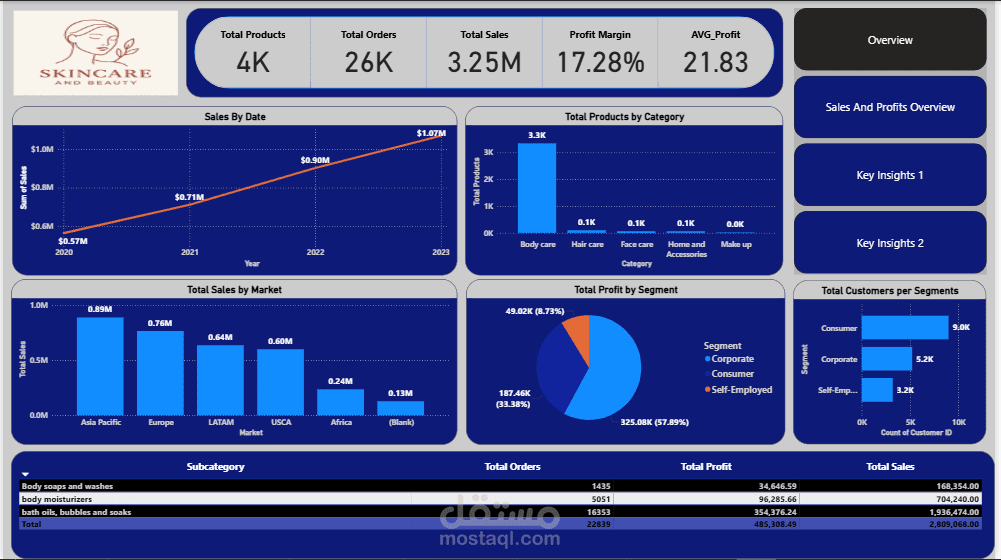
This comprehensive Power BI analytics solution provides a deep dive into global sales, profitability, and consumer behavior for a Skincare and Beauty retail brand. By processing over 26K orders spanning from 2020 to 2023 , the dashboard translates raw transactional data into high-impact strategic insights across geography, product hierarchies, and customer segments.
?️ Tech Stack & Architecture
Data Preparation & ETL: Python (Pandas, NumPy) for advanced data cleaning, preparation, and initial EDA.
Data Modeling: Optimized Snowflake Schema featuring a centralized Sales Fact table connected to Customer, Product, Geography, and Date dimension tables.
BI & Analytics: Power BI Desktop using advanced DAX for custom KPIs (Total Sales, Profit Margin, Average Profit) and dynamic filtering.
? Key Analytical Insights
Sustained Growth: Total revenue reached $3.25M across 26K orders , demonstrating a clear upward trajectory over time, growing from $0.57M in 2020 to $1.07M by 2023.
Regional Dominance: The Asia Pacific region is the primary revenue driver, contributing $0.89M in total sales, closely followed by Europe at $0.76M.
Product Performance: Product volume is heavily dominated by the Body Care category (generating 3.2M in sales) , with Body soaps and washes, Body moisturizers, and Bath oils, bubbles, and soaks leading order frequencies.
Segment Profitability: The Consumer segment is the most lucrative, accounting for 57.89% ($325.08K) of total profits, followed by Corporate (33.38%).
Discount vs. Profit Correlation: Advanced trend analysis shows that while average discounts dropped to 8.20% in 2021, average profits peaked at $53.45, highlighting a strong correlation between optimized pricing strategies and bottom-line health.
? Advanced BI Features Implemented
Dynamic Navigation & UX: Built-in multi-page navigation (Overview, Sales & Profits Overview, Key Insights) alongside a custom "Clear all slicers" feature for seamless exploration.
Decomposition Tree: Integrated advanced AI visuals to map total sales granularly down from Region to Country, State, and City.
Dynamic Slicers & Metrics: Implemented interactive level selectors allowing users to toggle trends dynamically by Category, Product, or Subcategory, and switch metrics seamlessly between Profit and Sales.
Geographical Mapping: Utilized interactive bubble maps to visualize cross-border product distribution and pinpoint high-spending international clusters.