Comprehensive Sales Performance & Distribution Dashboard
تفاصيل العمل
Project Overview:
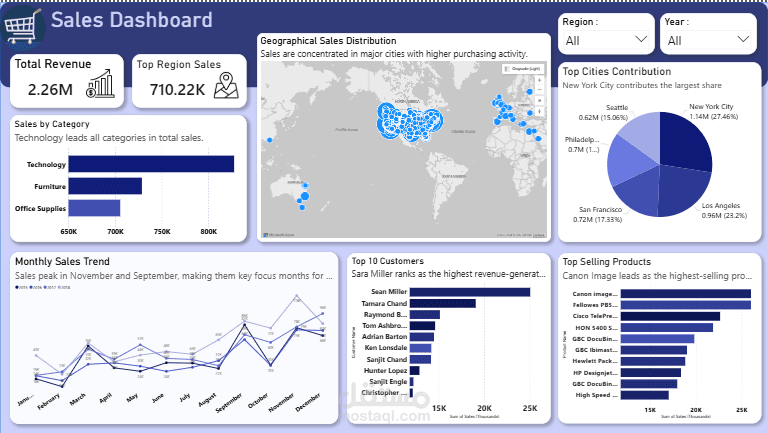
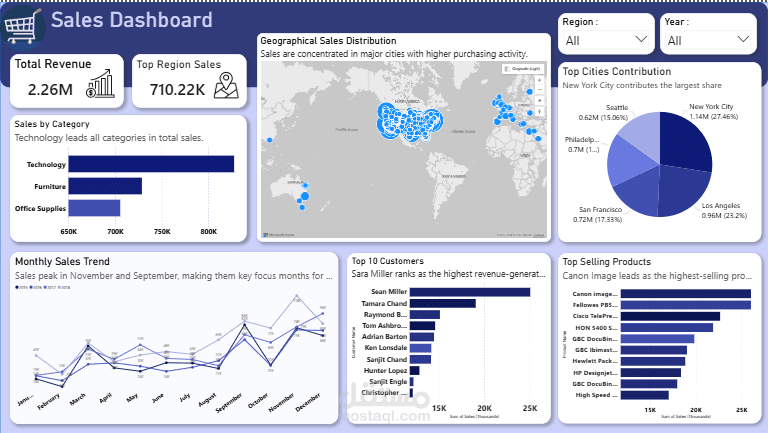
Developed an interactive Power BI dashboard to analyze a total revenue of $2.26M, providing a deep dive into sales trends, product performance, and geographical distribution. The dashboard enables stakeholders to monitor KPIs and identify growth opportunities across different market segments.
Key Features & Technical Implementation:
Performance Monitoring: Visualized key metrics including Total Revenue ($2.26M) and Top Region Sales ($710.22K).
Geographical Analysis: Integrated a map visualization to track sales density across different regions, identifying New York City as the top contributor (27.46% of city sales).
Time-Series Insights: Analyzed Monthly Sales Trends, pinpointing peak performance in November and September to help in inventory and marketing planning.
Product & Category Intelligence: Created breakdowns for product categories (Technology, Furniture, Office Supplies) and identified top-selling products like Canon Image Class.
Customer Profiling: Ranked the top 10 customers by revenue to support CRM and loyalty strategies.
Technical Stack: Leveraged Power BI for data visualization, DAX for calculated KPIs, and advanced data modeling for seamless filtering by region and year.