Adidas Sales Performance & Profitability Dashboard
تفاصيل العمل


Adidas Sales Performance & Profitability Dashboard
In this project, I built a fully interactive dashboard to analyze:
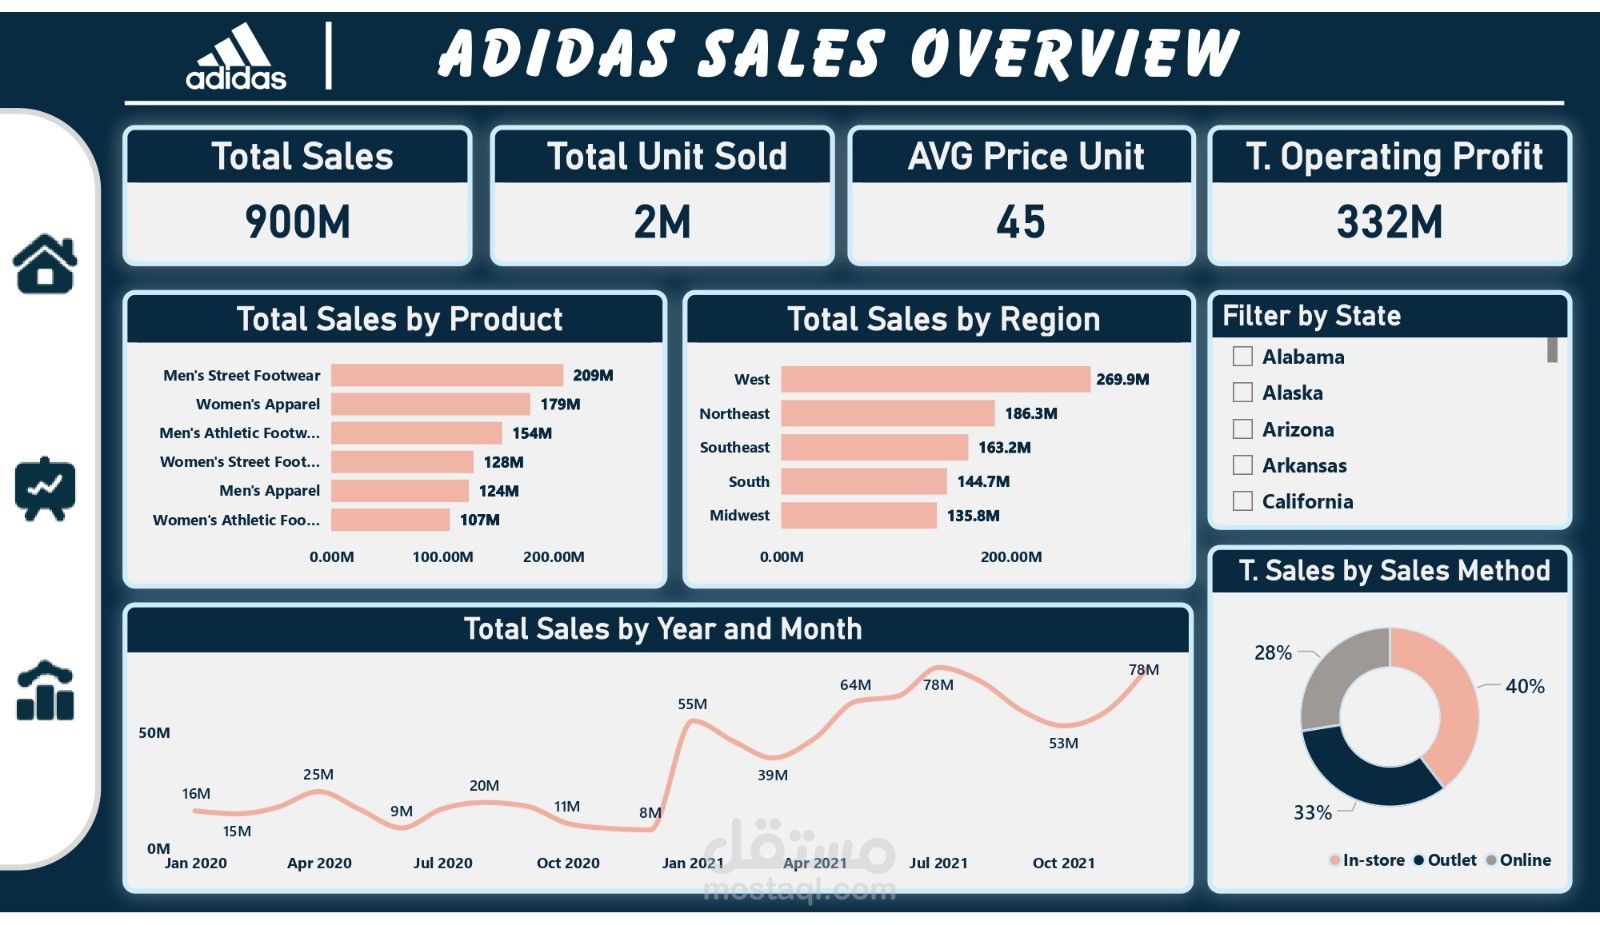
? Total Sales, Units Sold & Operating Profit
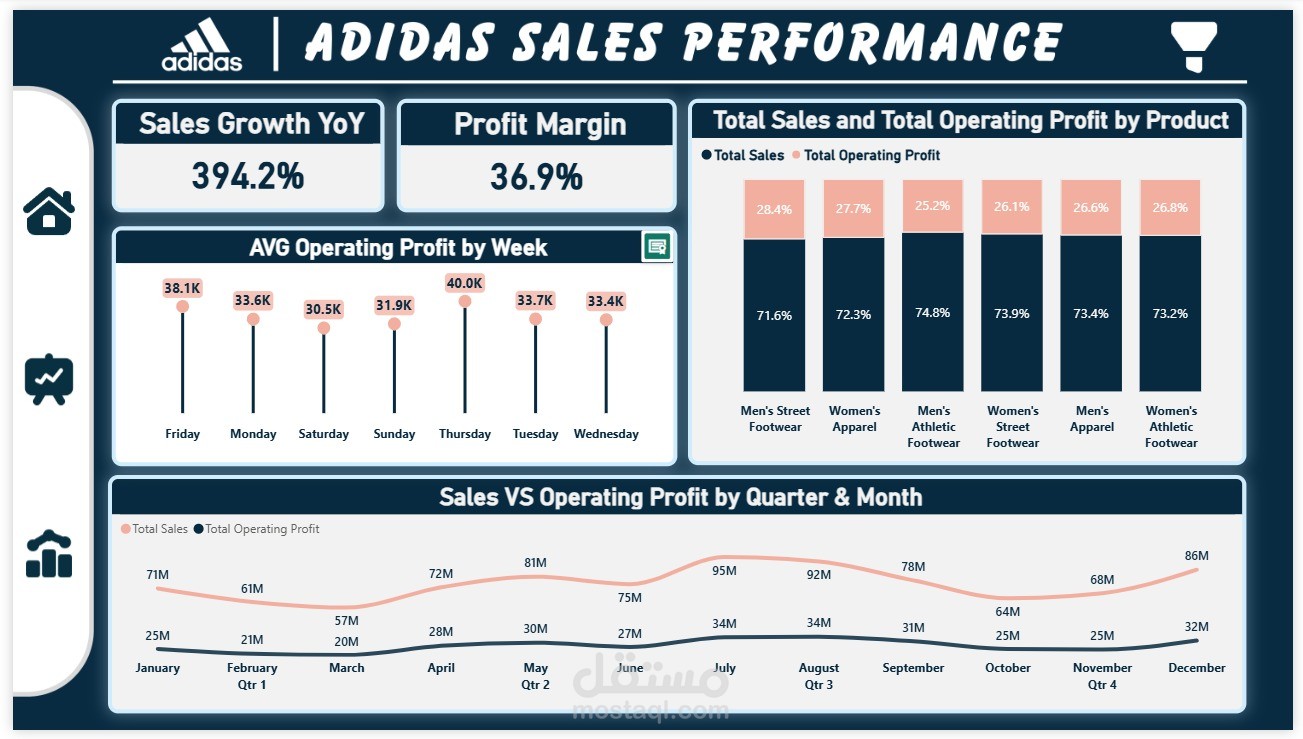
? Sales Growth YoY & Profit Margin
? Top Performing Product & Region
? Sales by Method (In-store, Outlet, Online)
? Monthly & Quarterly Performance Trends
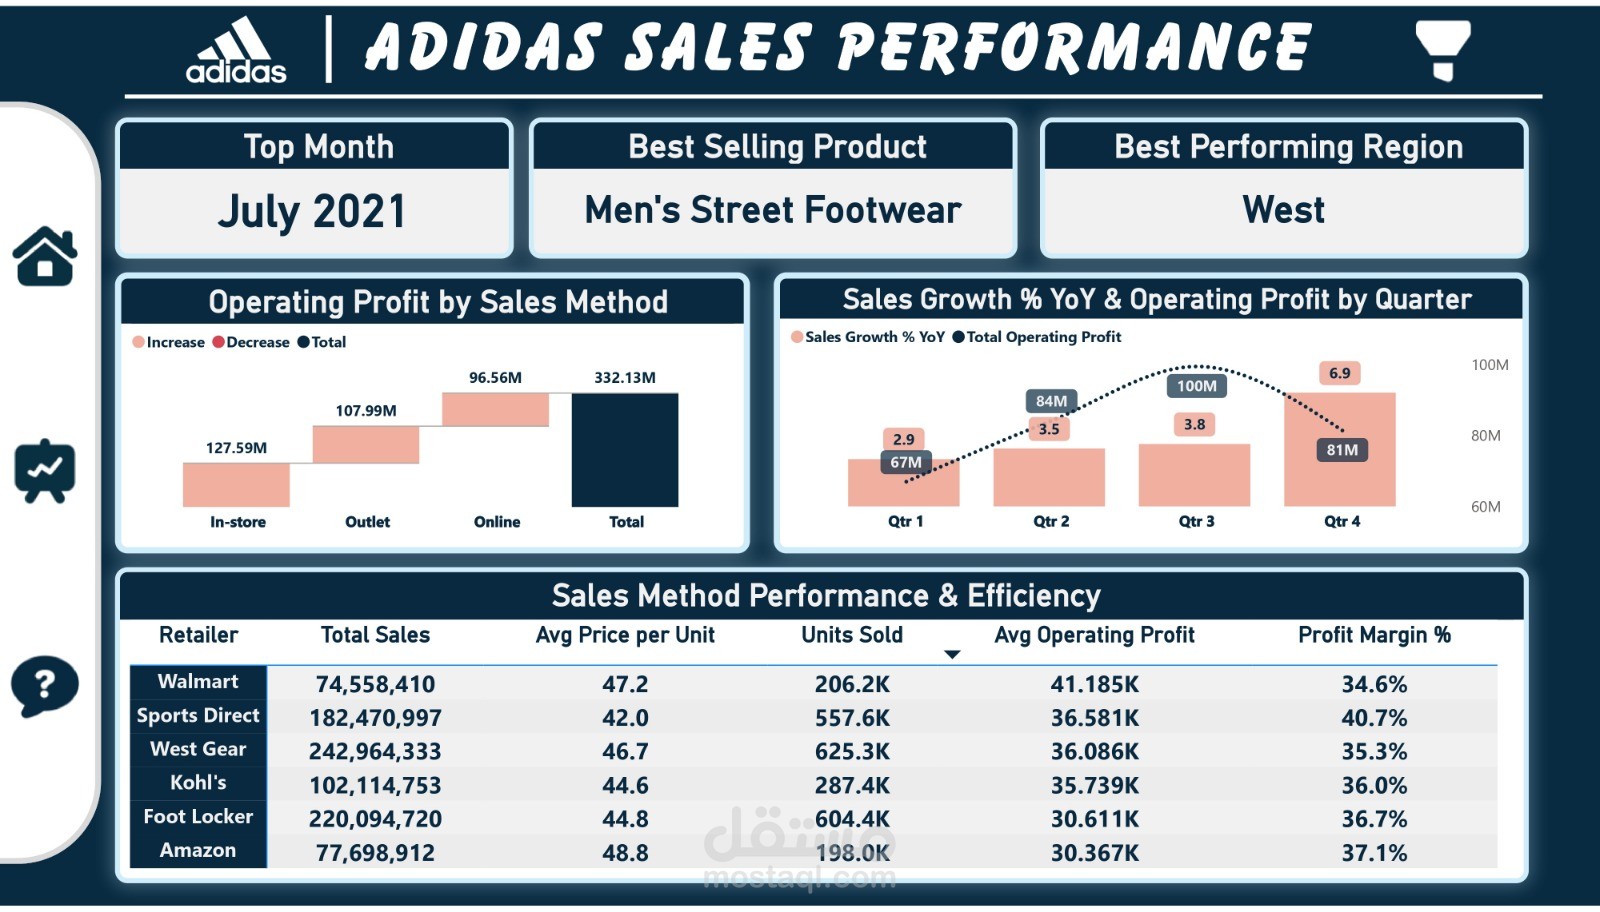
? Retailer Efficiency Analysis
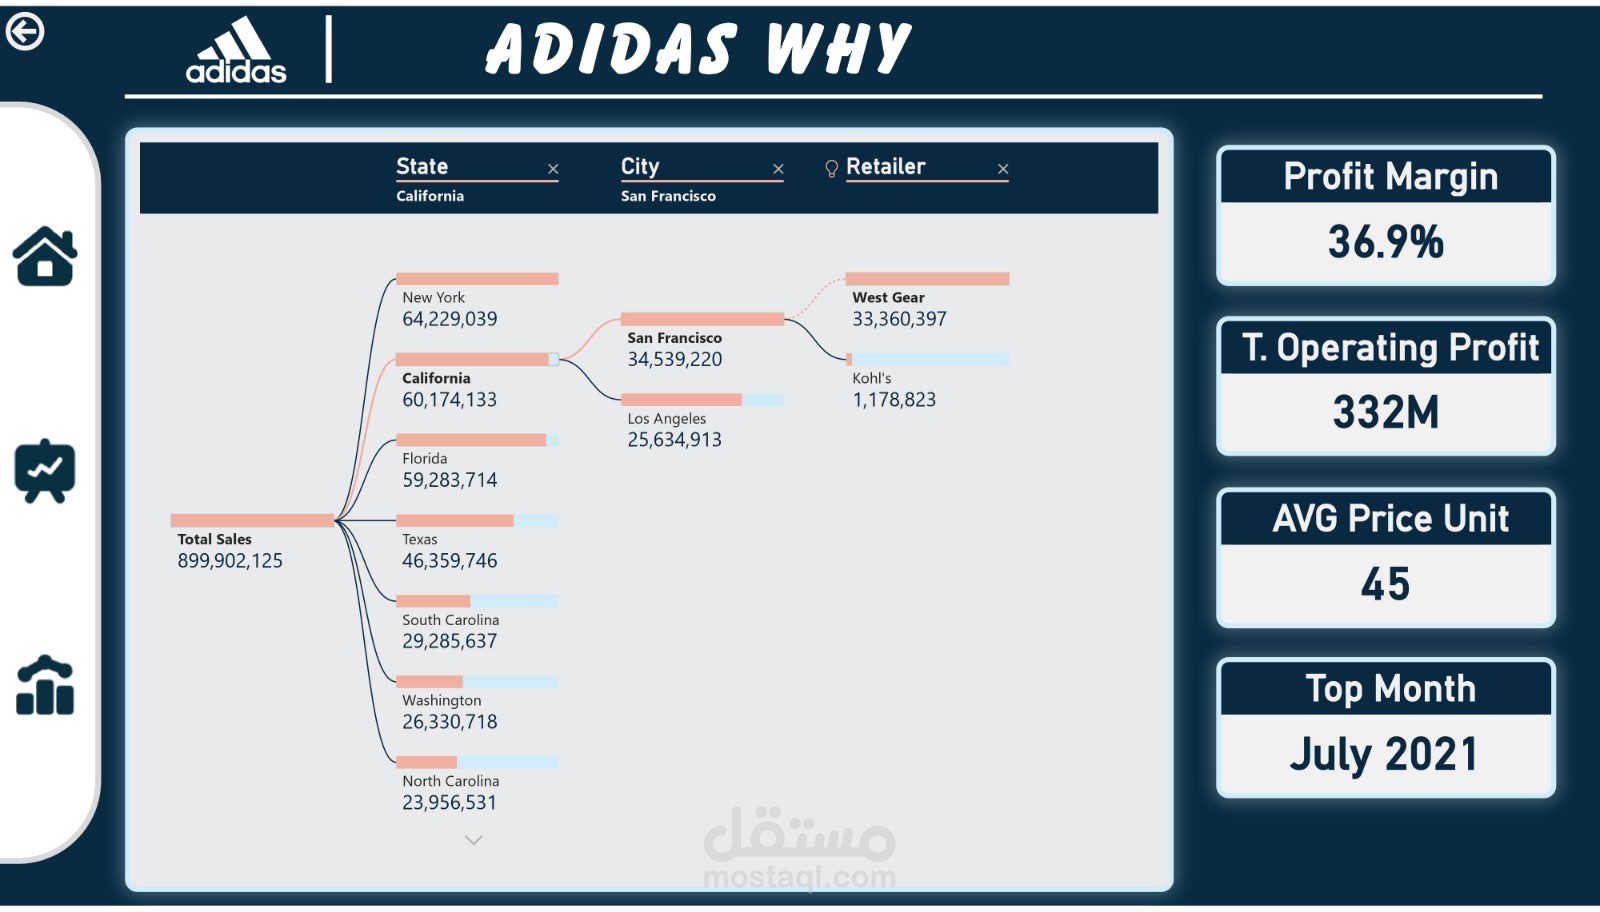
? Drill-through analysis by State → City → Retailer
? Key Insights:
• 900M Total Sales
• 332M Operating Profit
• 36.9% Profit Margin
• Best Month: July 2021
• Best Selling Product: Men’s Street Footwear
? Tools Used:
• Power BI
• DAX (Time Intelligence, Ranking, Growth % Calculations)
• Data Modeling
• Interactive Drill-through & Smart Features
This project helped me strengthen my skills in:
✔ Business KPI Design
✔ Data Storytelling
✔ Advanced DAX Calculations
✔ Dashboard UI/UX Design