Sales Analysis Dashboard (Excel Project)
تفاصيل العمل
? Sales Analysis Dashboard (Excel Project)
? Overview
This project analyzes sales performance, profitability, and customer behavior using Excel. The goal is to identify key business issues affecting profitability and provide actionable recommendations.
? Business Problem
Despite strong sales performance, the company faces inconsistent profitability and occasional losses. The objective is to identify the root causes and improve decision-making.
? Dataset
The dataset includes:
Sales
Profit
Discount
Customer information
Product categories (Technology, Furniture, Office Supplies)
? Analysis Process
1. Data Cleaning
Removed duplicate records
Validated dataset consistency
Final dataset: 7,456 rows
2. Data Analysis
Sales & Profit analysis by category
Customer segmentation (Profitable / Neutral / Loss)
Discount impact on profitability
Product-level analysis (Root Cause)
? Key Insights
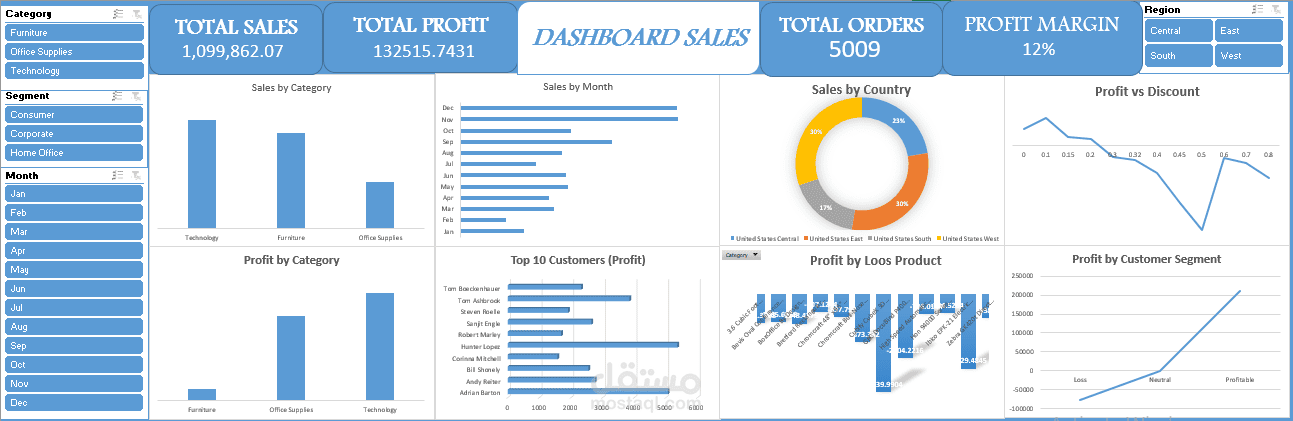
Technology is the highest-performing category in terms of sales and profit
Office Supplies and Furniture contribute significantly to losses
Approximately 18–19% of customers generate losses
High discount levels and repeated sales of low-margin products drive losses
Losses are concentrated in specific products, not entire categories
? Dashboard Features
KPIs:
Total Sales
Total Profit
Total Orders
Profit Margin
Interactive filters:
Category
Region
Segment
Month
Visualizations:
Sales by Category
Profit by Category
Sales by Month
Profit vs Discount
Top Customers
Loss-making Products
? Recommendations
Implement stricter control over discount strategies, especially for low-margin products
Focus on high-performing and high-margin products
Apply discounts strategically (seasonal campaigns instead of continuous discounts)
Investigate loss-making products and adjust pricing or positioning
? Tools Used
Microsoft Excel
Pivot Tables
Data Visualization
Dashboard Design
? Project Outcome
This project demonstrates the ability to:
Analyze business performance
Identify root causes of financial issues
Translate data into actionable business insights
Build interactive dashboards for decision-making