Sales_dashboard_Using_tableau
تفاصيل العمل
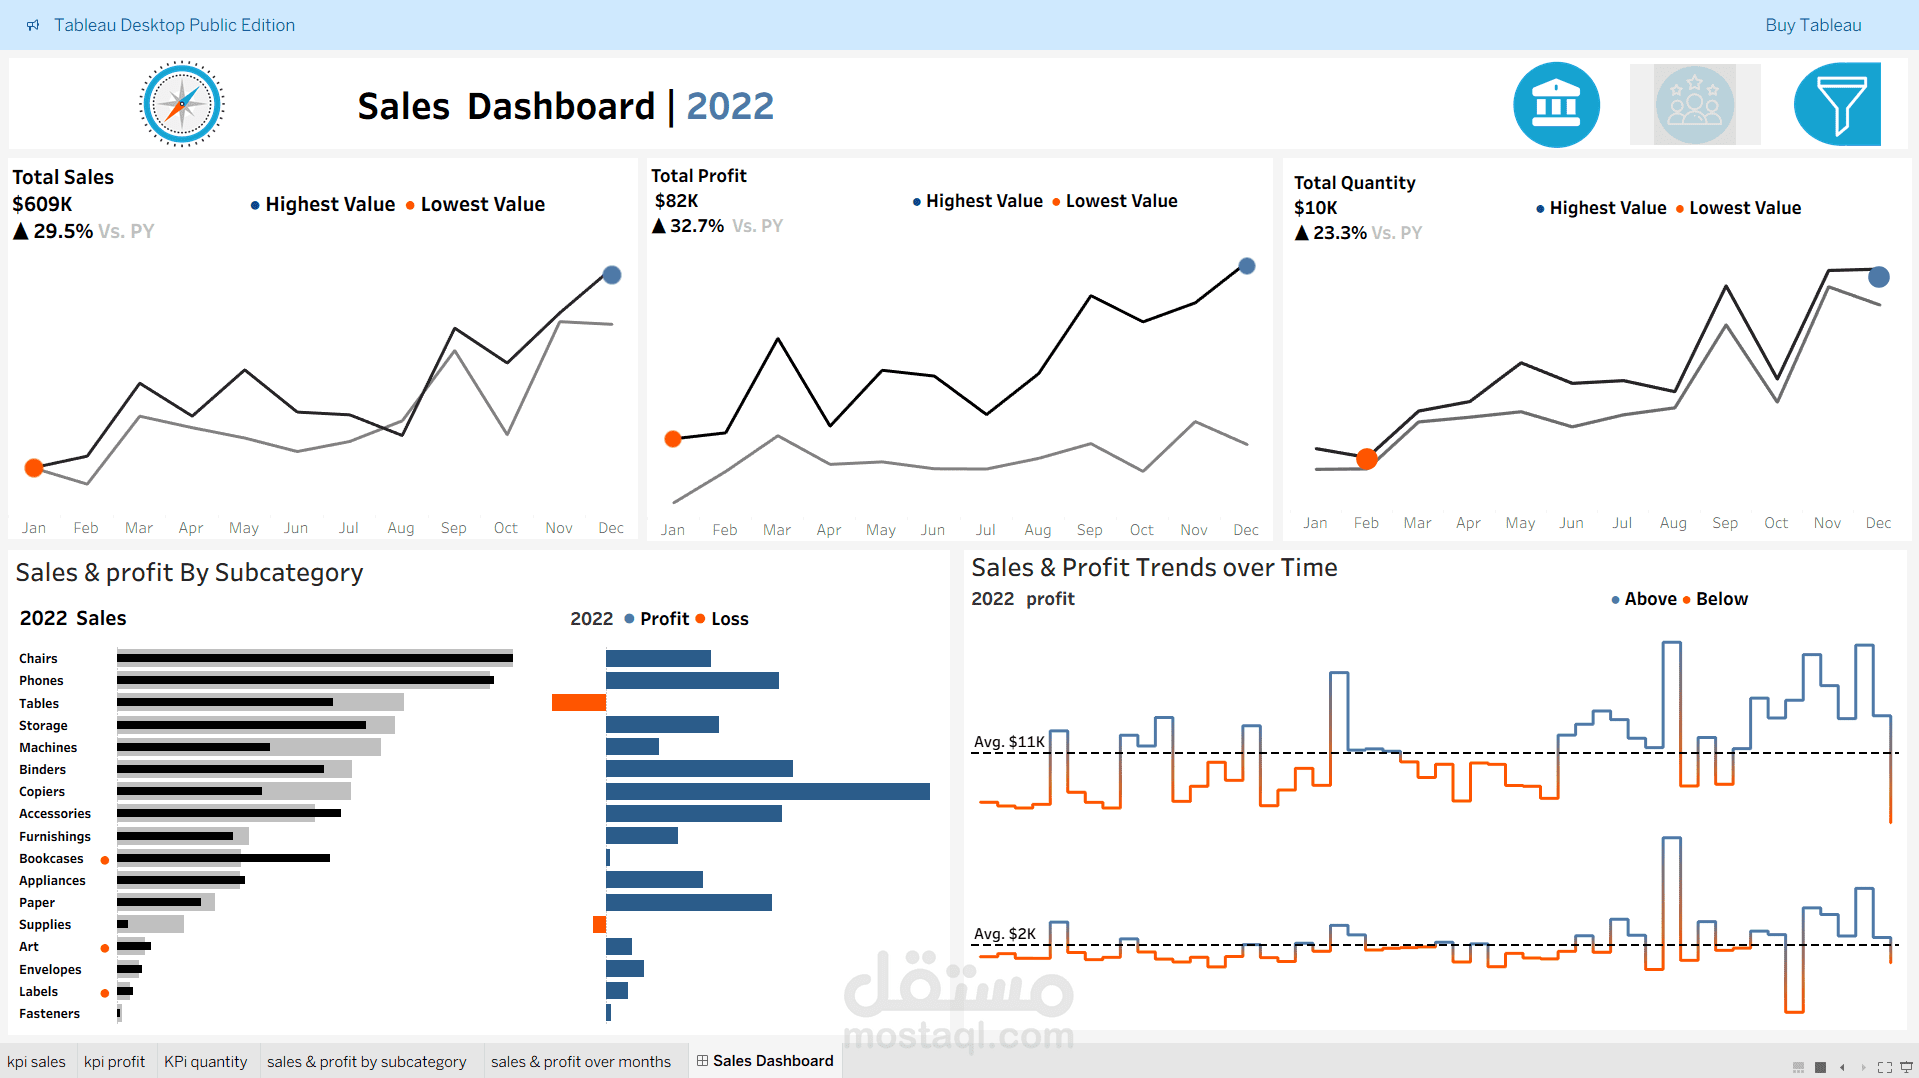

Tableau Sales Dashboard | 2022
Interactive Sales Dashboard built using Tableau to analyze sales performance, track profitability, and monitor key business metrics across time. The dashboard delivers clear KPIs such as Total Sales ($609K), Total Profit ($82K), and Total Quantity ($10K) — each benchmarked against the previous year to highlight real growth. Dynamic subcategory breakdowns and trend visualizations make data exploration seamless and support confident business decisions.
Tools Used:
Tableau Desktop Public Edition
Calculated Fields & KPI Sheets
Year-over-Year Comparison Logic
Key Features:
KPI cards showing Total Sales, Profit, and Quantity vs. prior year performance
Year-over-year growth tracking (+29.5% Sales, +32.7% Profit, +23.3% Quantity)
Sales & Profit breakdown by subcategory with profit/loss identification
Trend analysis over time with above/below average profit indicators
Highest and lowest value markers on every KPI trend line
Multi-tab layout covering KPI Sales, KPI Profit, KPI Quantity, and Subcategory views
Clean, modern design built for fast, intuitive decision-making