Goibibo Flights (Power BI)
تفاصيل العمل
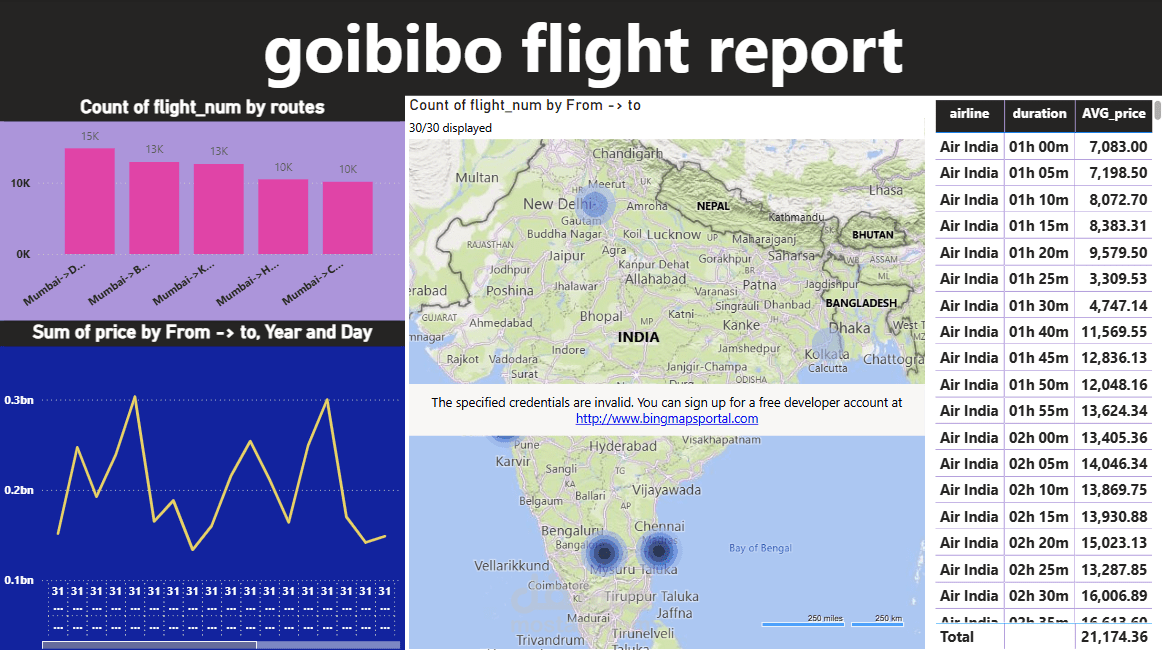
1. Build a dashboard to display the number of flights between top 5 routes.
2. Create a line chart showing price trends for flights between two specific cities over time.
3. Display the average flight price and duration per airline in a table.
4. Set up a map visualization showing the most common routes between cities.