Cairo
تفاصيل العمل
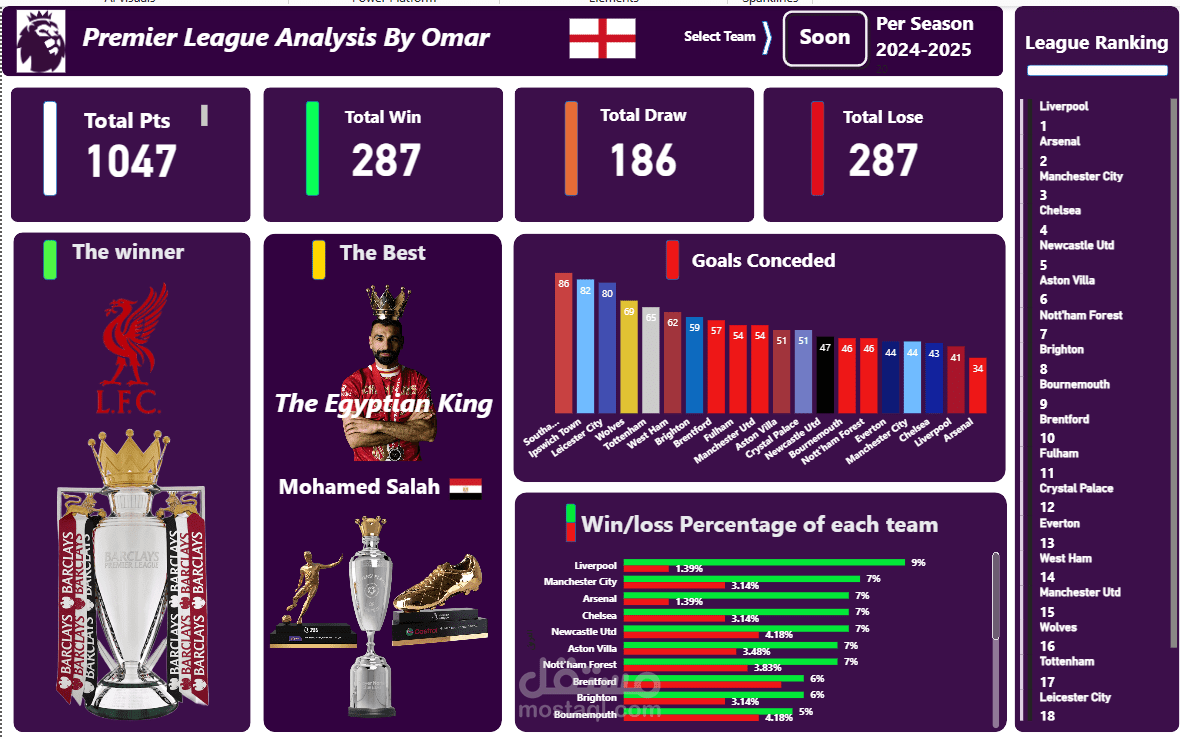
? Premier League Data Analysis Dashboard | By Omar
I’m excited to share my latest Data Analysis project, where I built an interactive dashboard to evaluate team performance in the Premier League using data-driven insights to identify the key factors behind success.
? A short video walkthrough (no audio) is attached to demonstrate the dashboard structure, KPIs, and analytical insights.
? Key Insights
? Defense is a decisive factor in winning titles
Arsenal recorded the lowest Goals Conceded (34) ?️, highlighting strong defensive organization and tactical discipline.
? Arsenal could have won the league
Based on the analysis, Arsenal showed the strongest defensive performance. If their attacking output had been closer to Liverpool and Manchester City, they could have been strong title winners. This shows the impact of combining elite defense with competitive attack.
? Liverpool leads through balance
Liverpool ranks at the top due to consistent performance, strong win rate, and effective attacking output.
? Manchester City shows performance consistency
Manchester City remains among the top teams due to structured gameplay and stable results.
? Impact of key players
Mohamed Salah represents the importance of individual excellence contributing to team success.
? Dashboard KPIs
Total Points: 1047
Total Wins: 287
Total Draws: 186
Total Losses: 287
Goals Conceded comparison
Win/Loss % per team
League ranking overview
? Tools Used
SQL for data extraction & preparation
Power BI for data visualization & dashboard design
? Key Takeaway: Goals Conceded is one of the most influential KPIs affecting league ranking, and strong defensive structure significantly increases title chances.
I appreciate your feedback! ?