Cairo
تفاصيل العمل
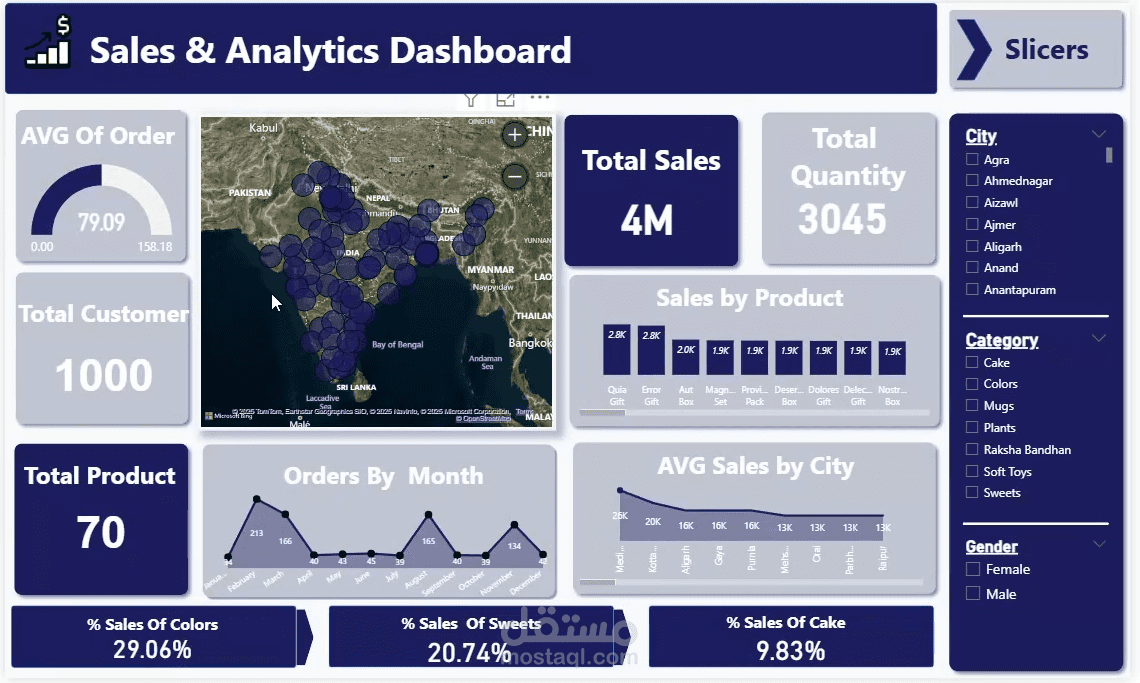
? Just published my first real Power BI project!
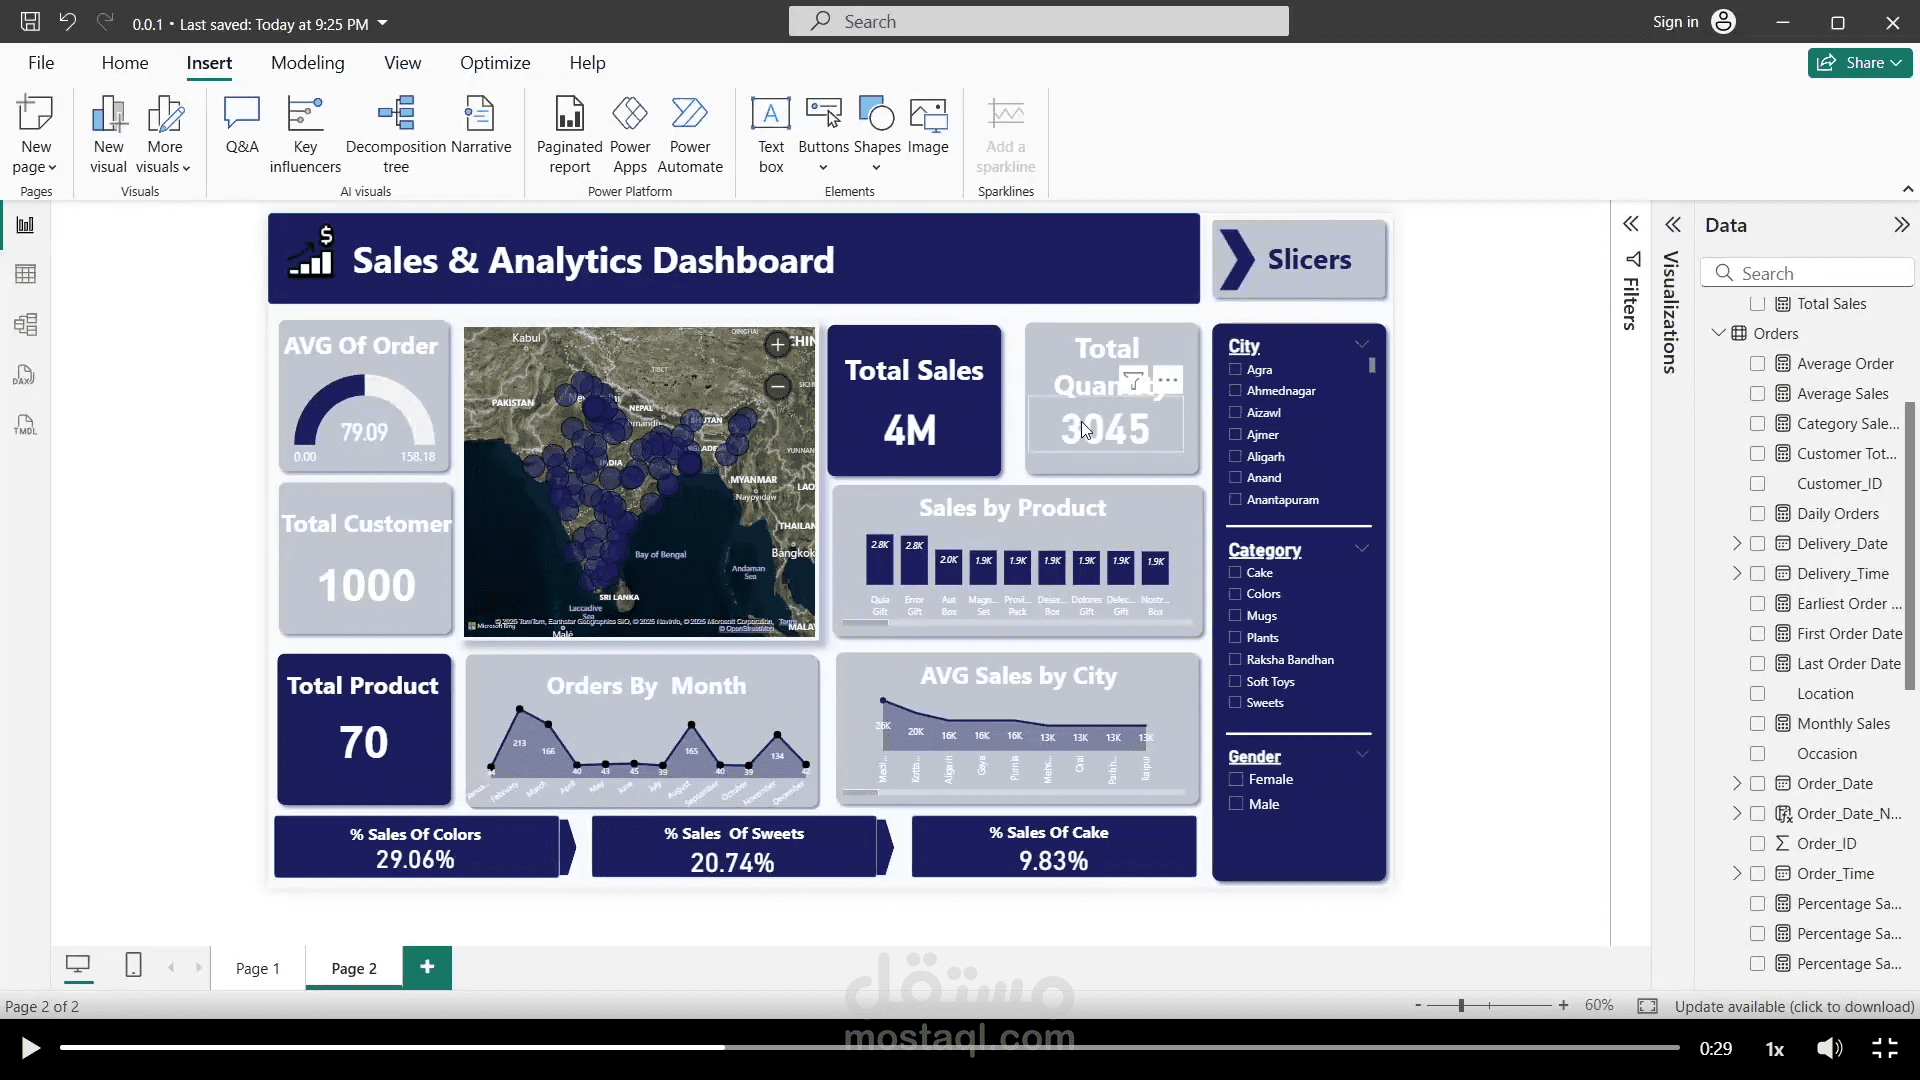
I built a complete Sales & Analytics Dashboard from the ground up, starting with data cleaning, modeling, and designing an end-to-end analytical report.
While exploring the data, one insight immediately stood out:
➡️ Out of 70 total products, only 3 products contribute to almost 50% of total sales.
This means that the remaining 67 products combined generate the other 50%, showing a strong concentration of revenue in a very small part of the product portfolio.
This insight can help the business identify:
• Which products should be prioritized and pushed more
• Where marketing and inventory decisions should focus
• Which low-performing products need review or improvement
Building this dashboard helped me practice:
✔️ Data modeling (fact & dimension tables)
✔️ DAX measures
✔️ Sales trend analysis
✔️ Customer behavior insights
✔️ Turning raw data into meaningful business decisions
Excited to keep improving and sharing more projects! ?