Adidas Sales & Profitability Dashboard
تفاصيل العمل

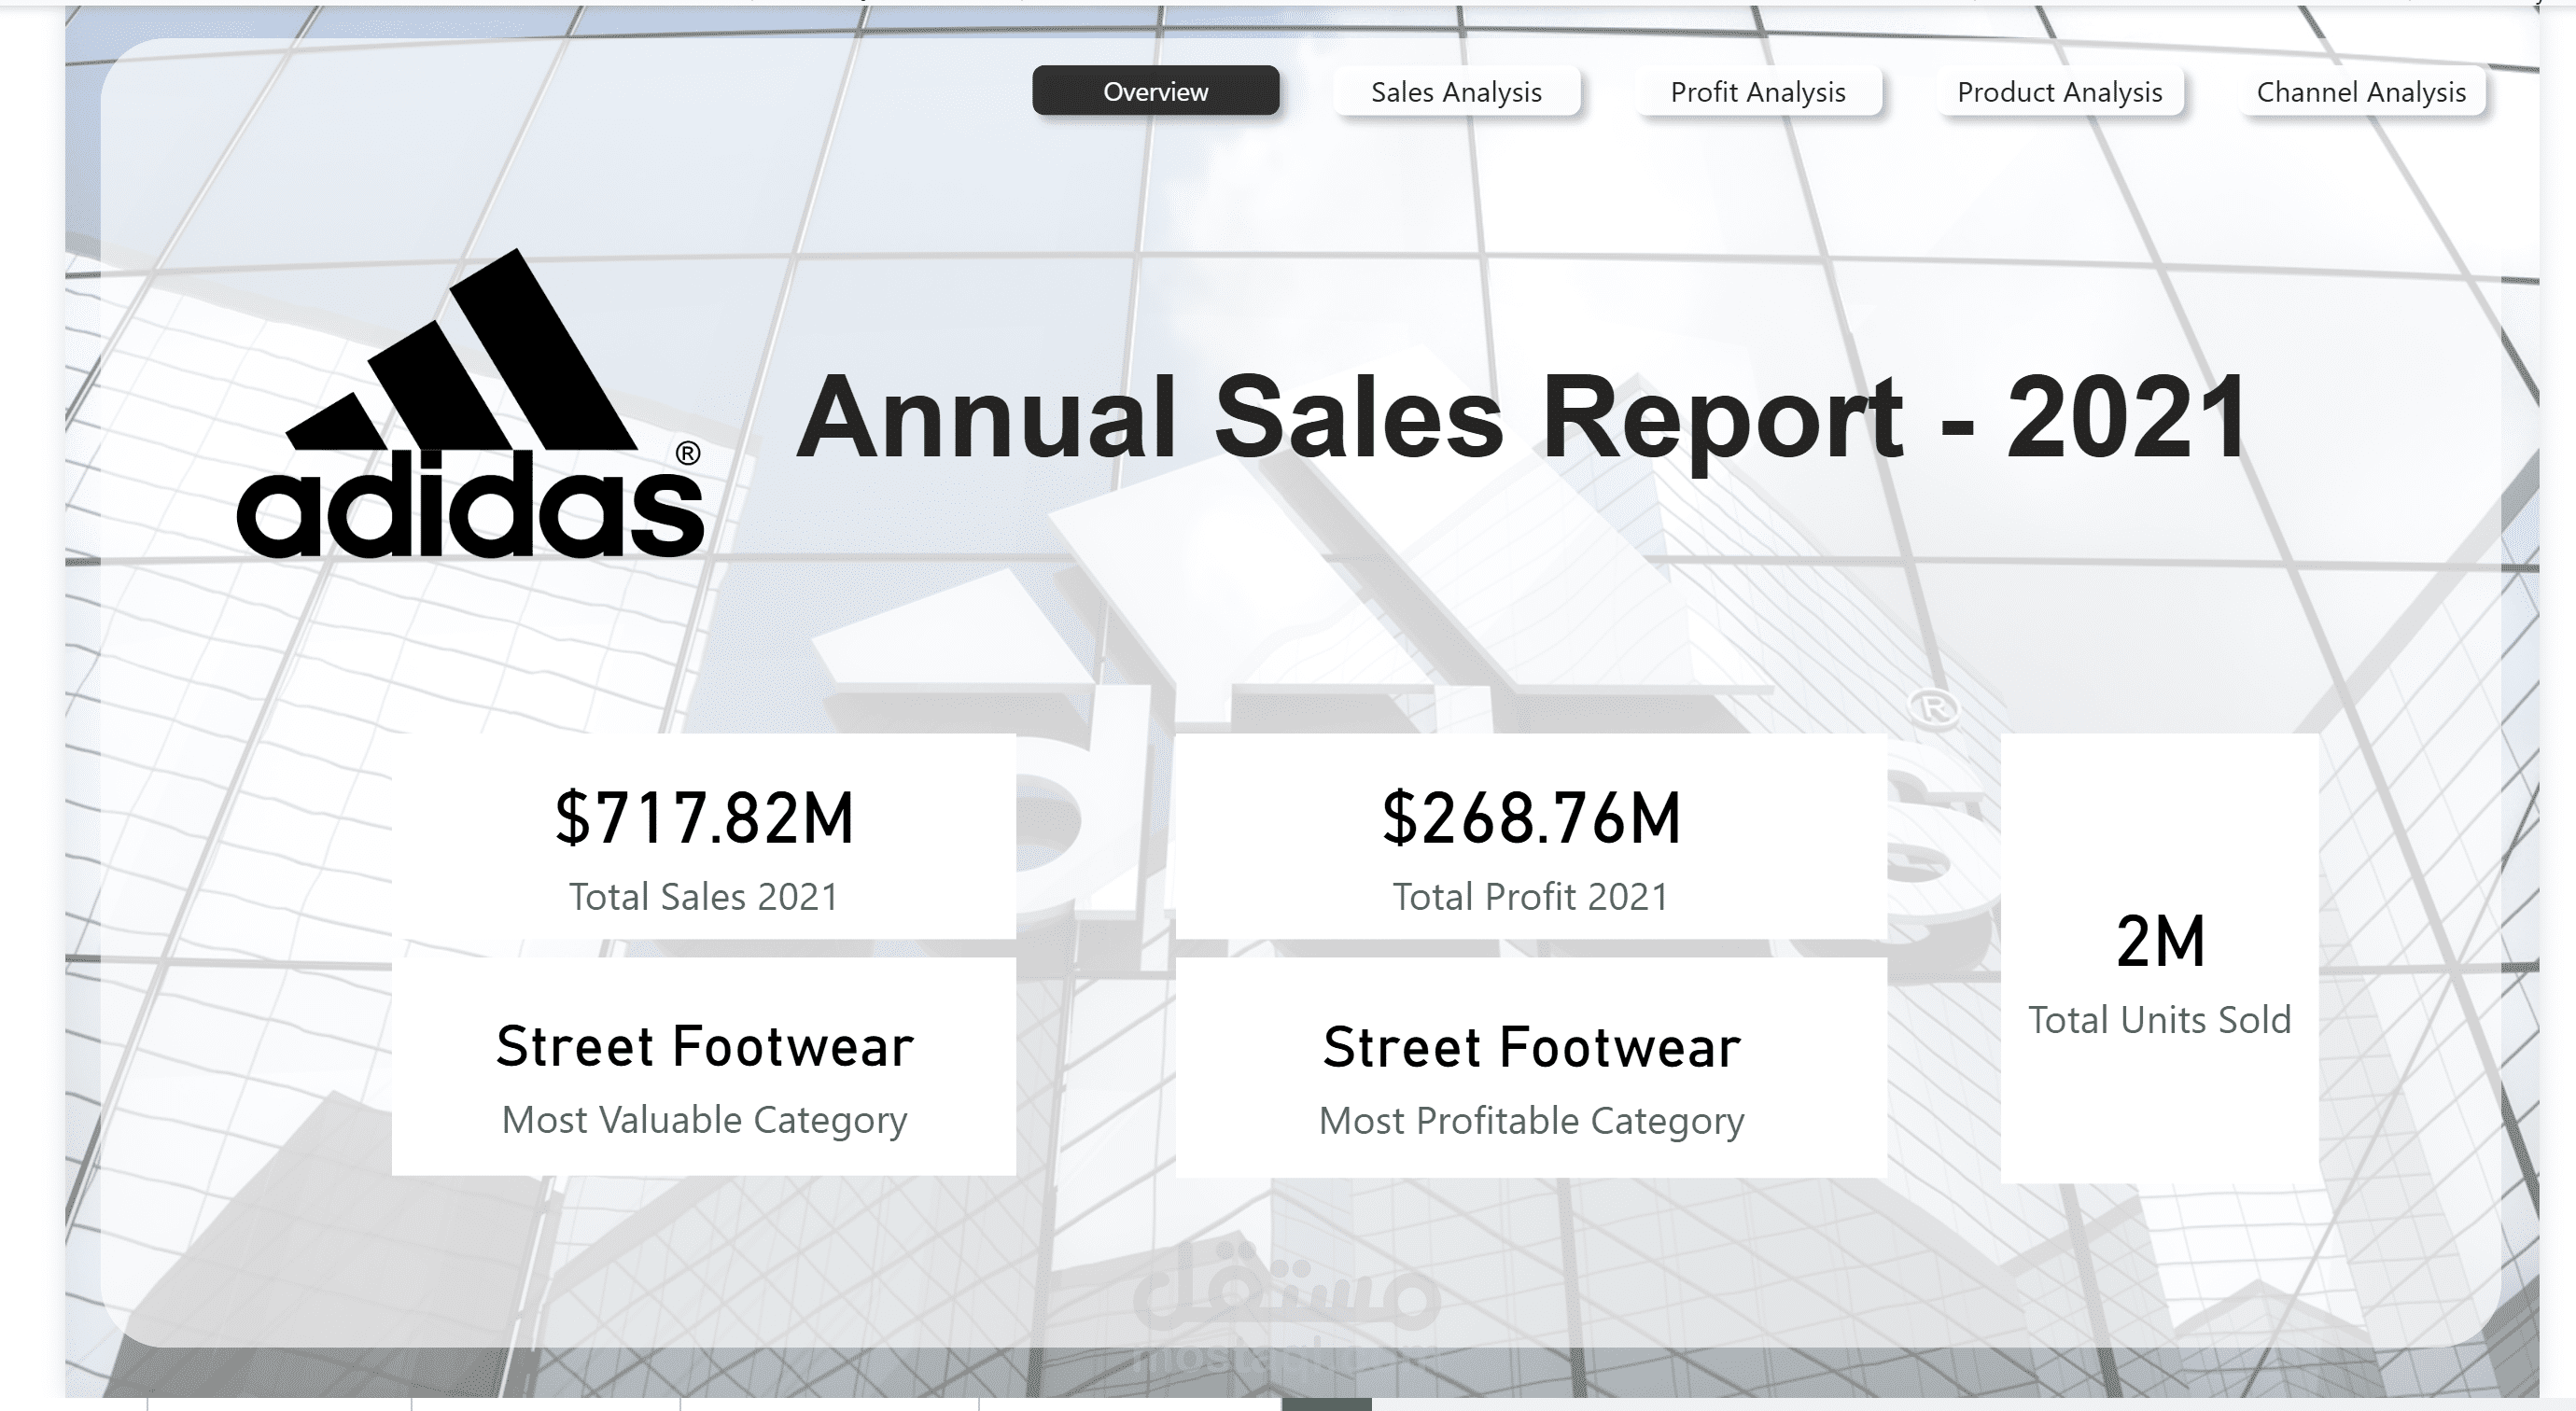
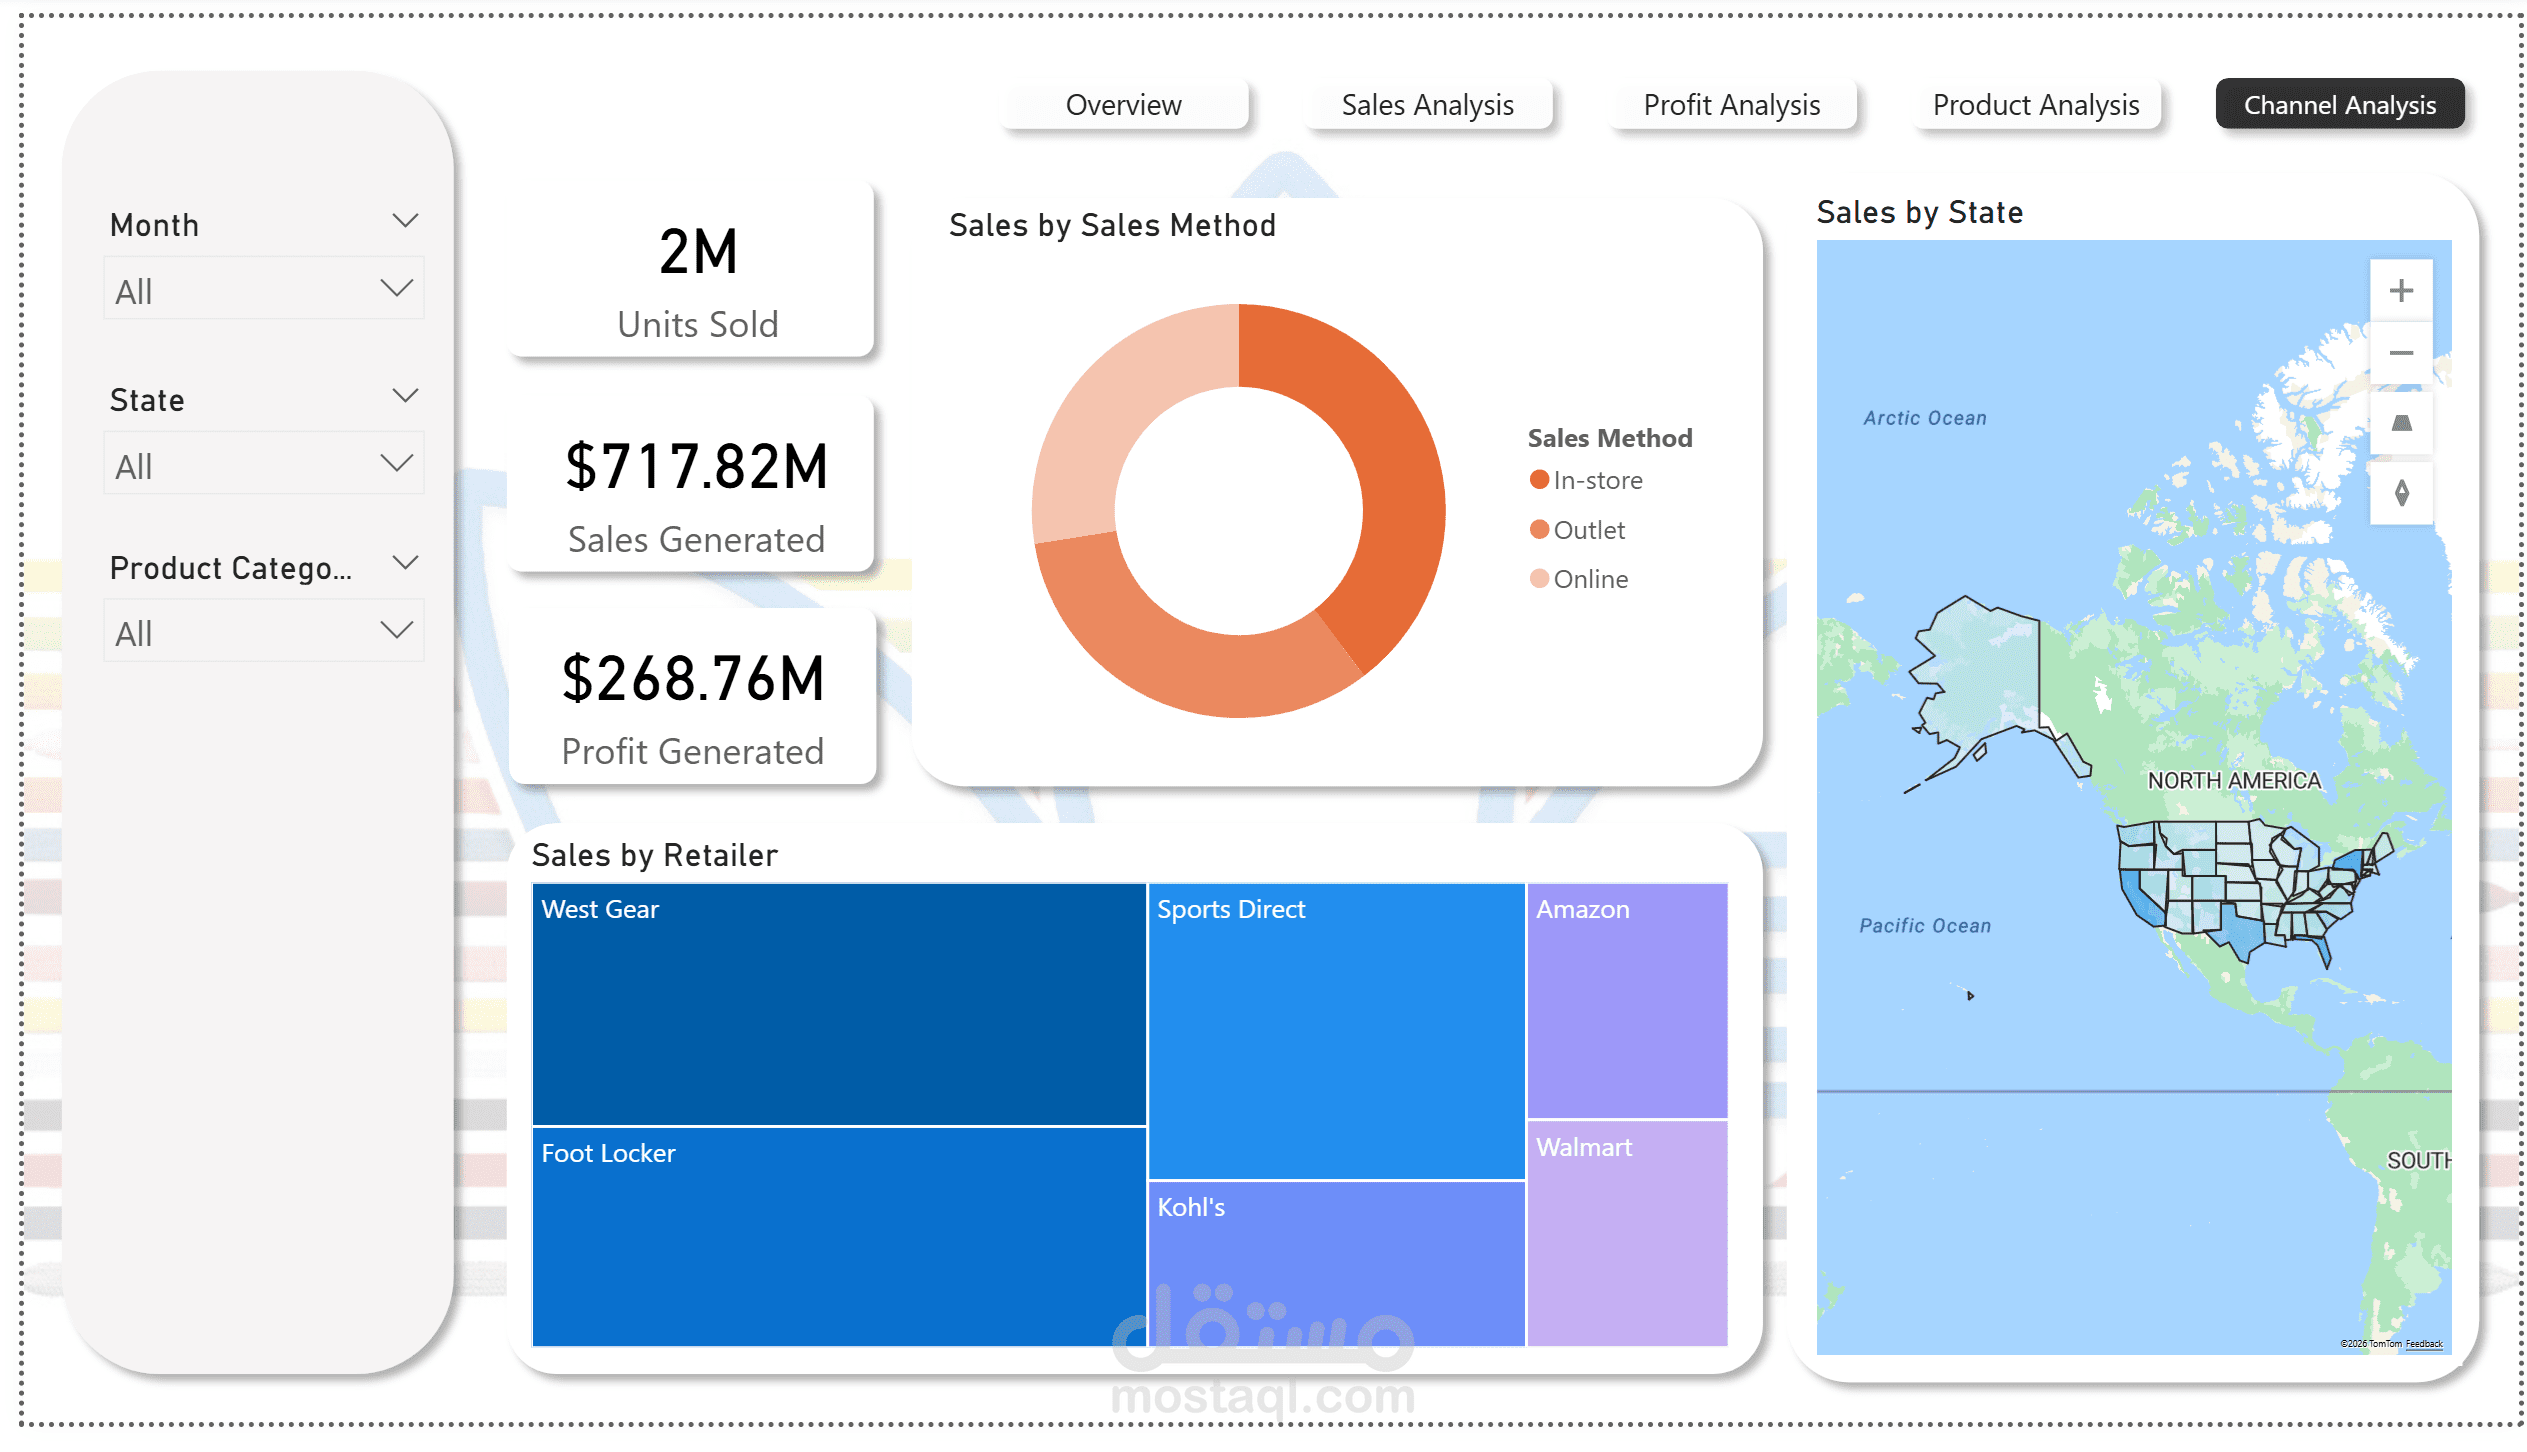
Overview:
An interactive Power BI dashboard designed to analyze Adidas' sales performance in the US market, providing clear insights into revenue, profit margins, and sales channels.
Key Highlights:
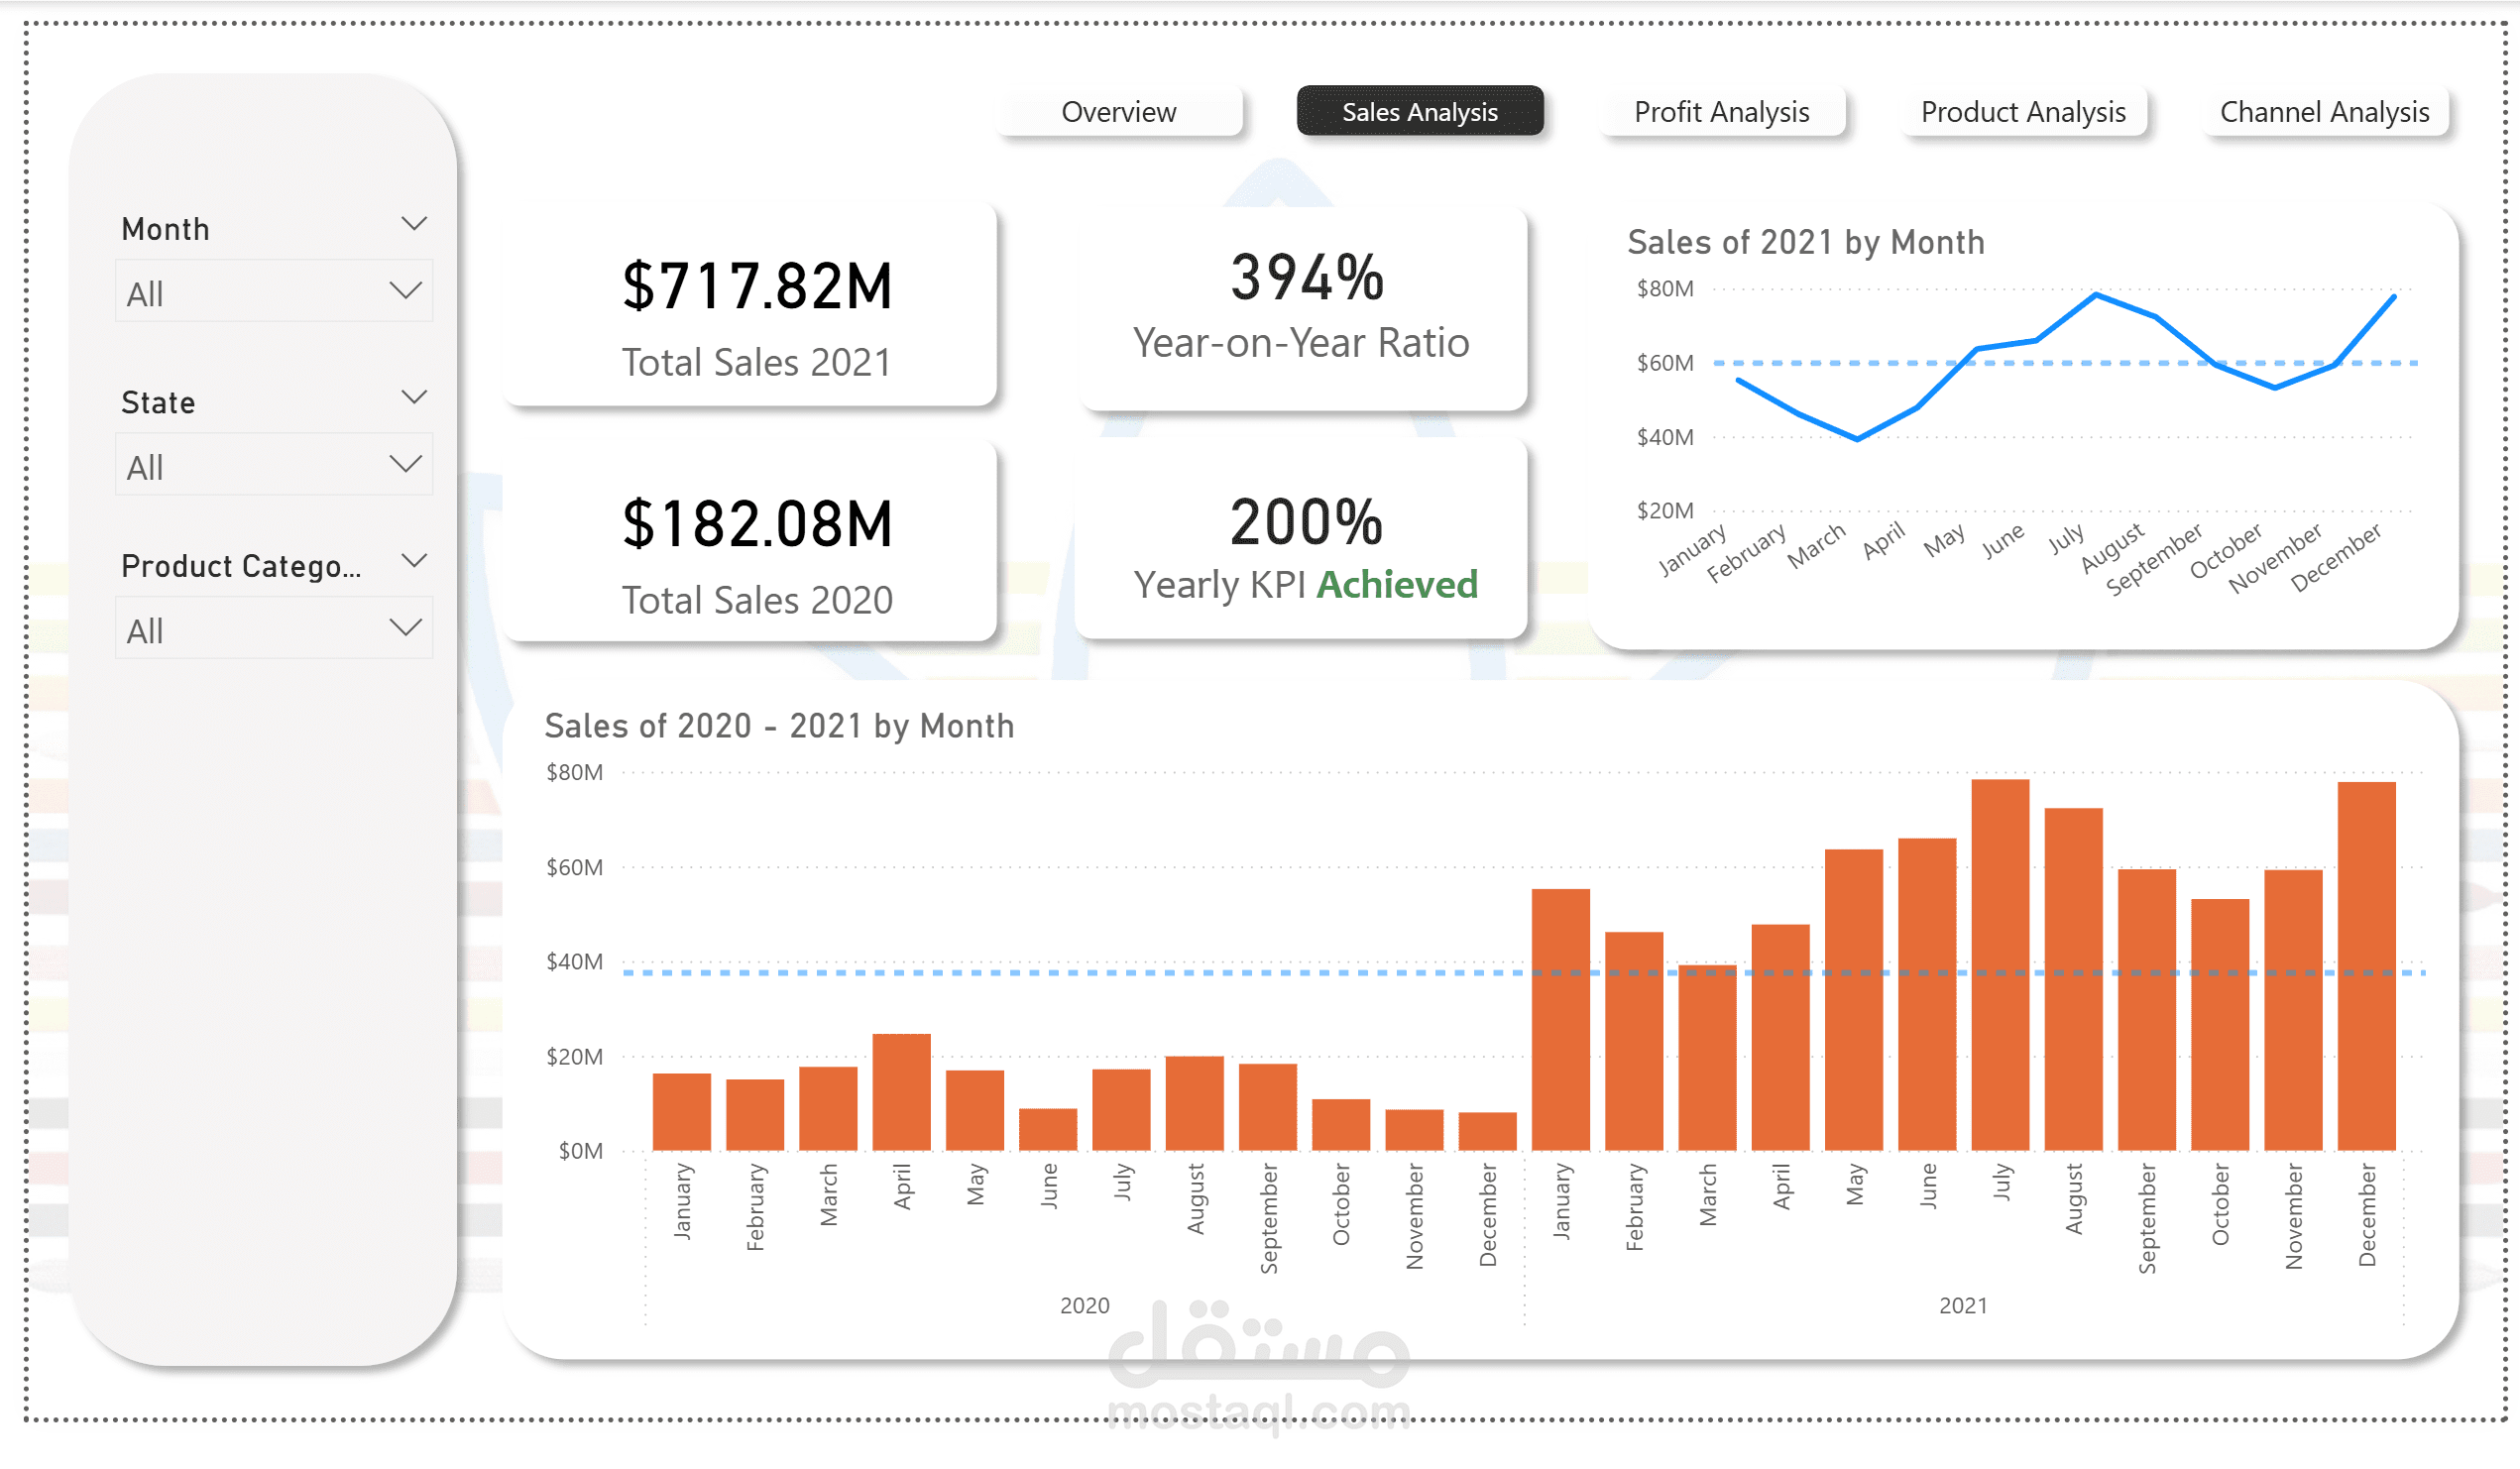
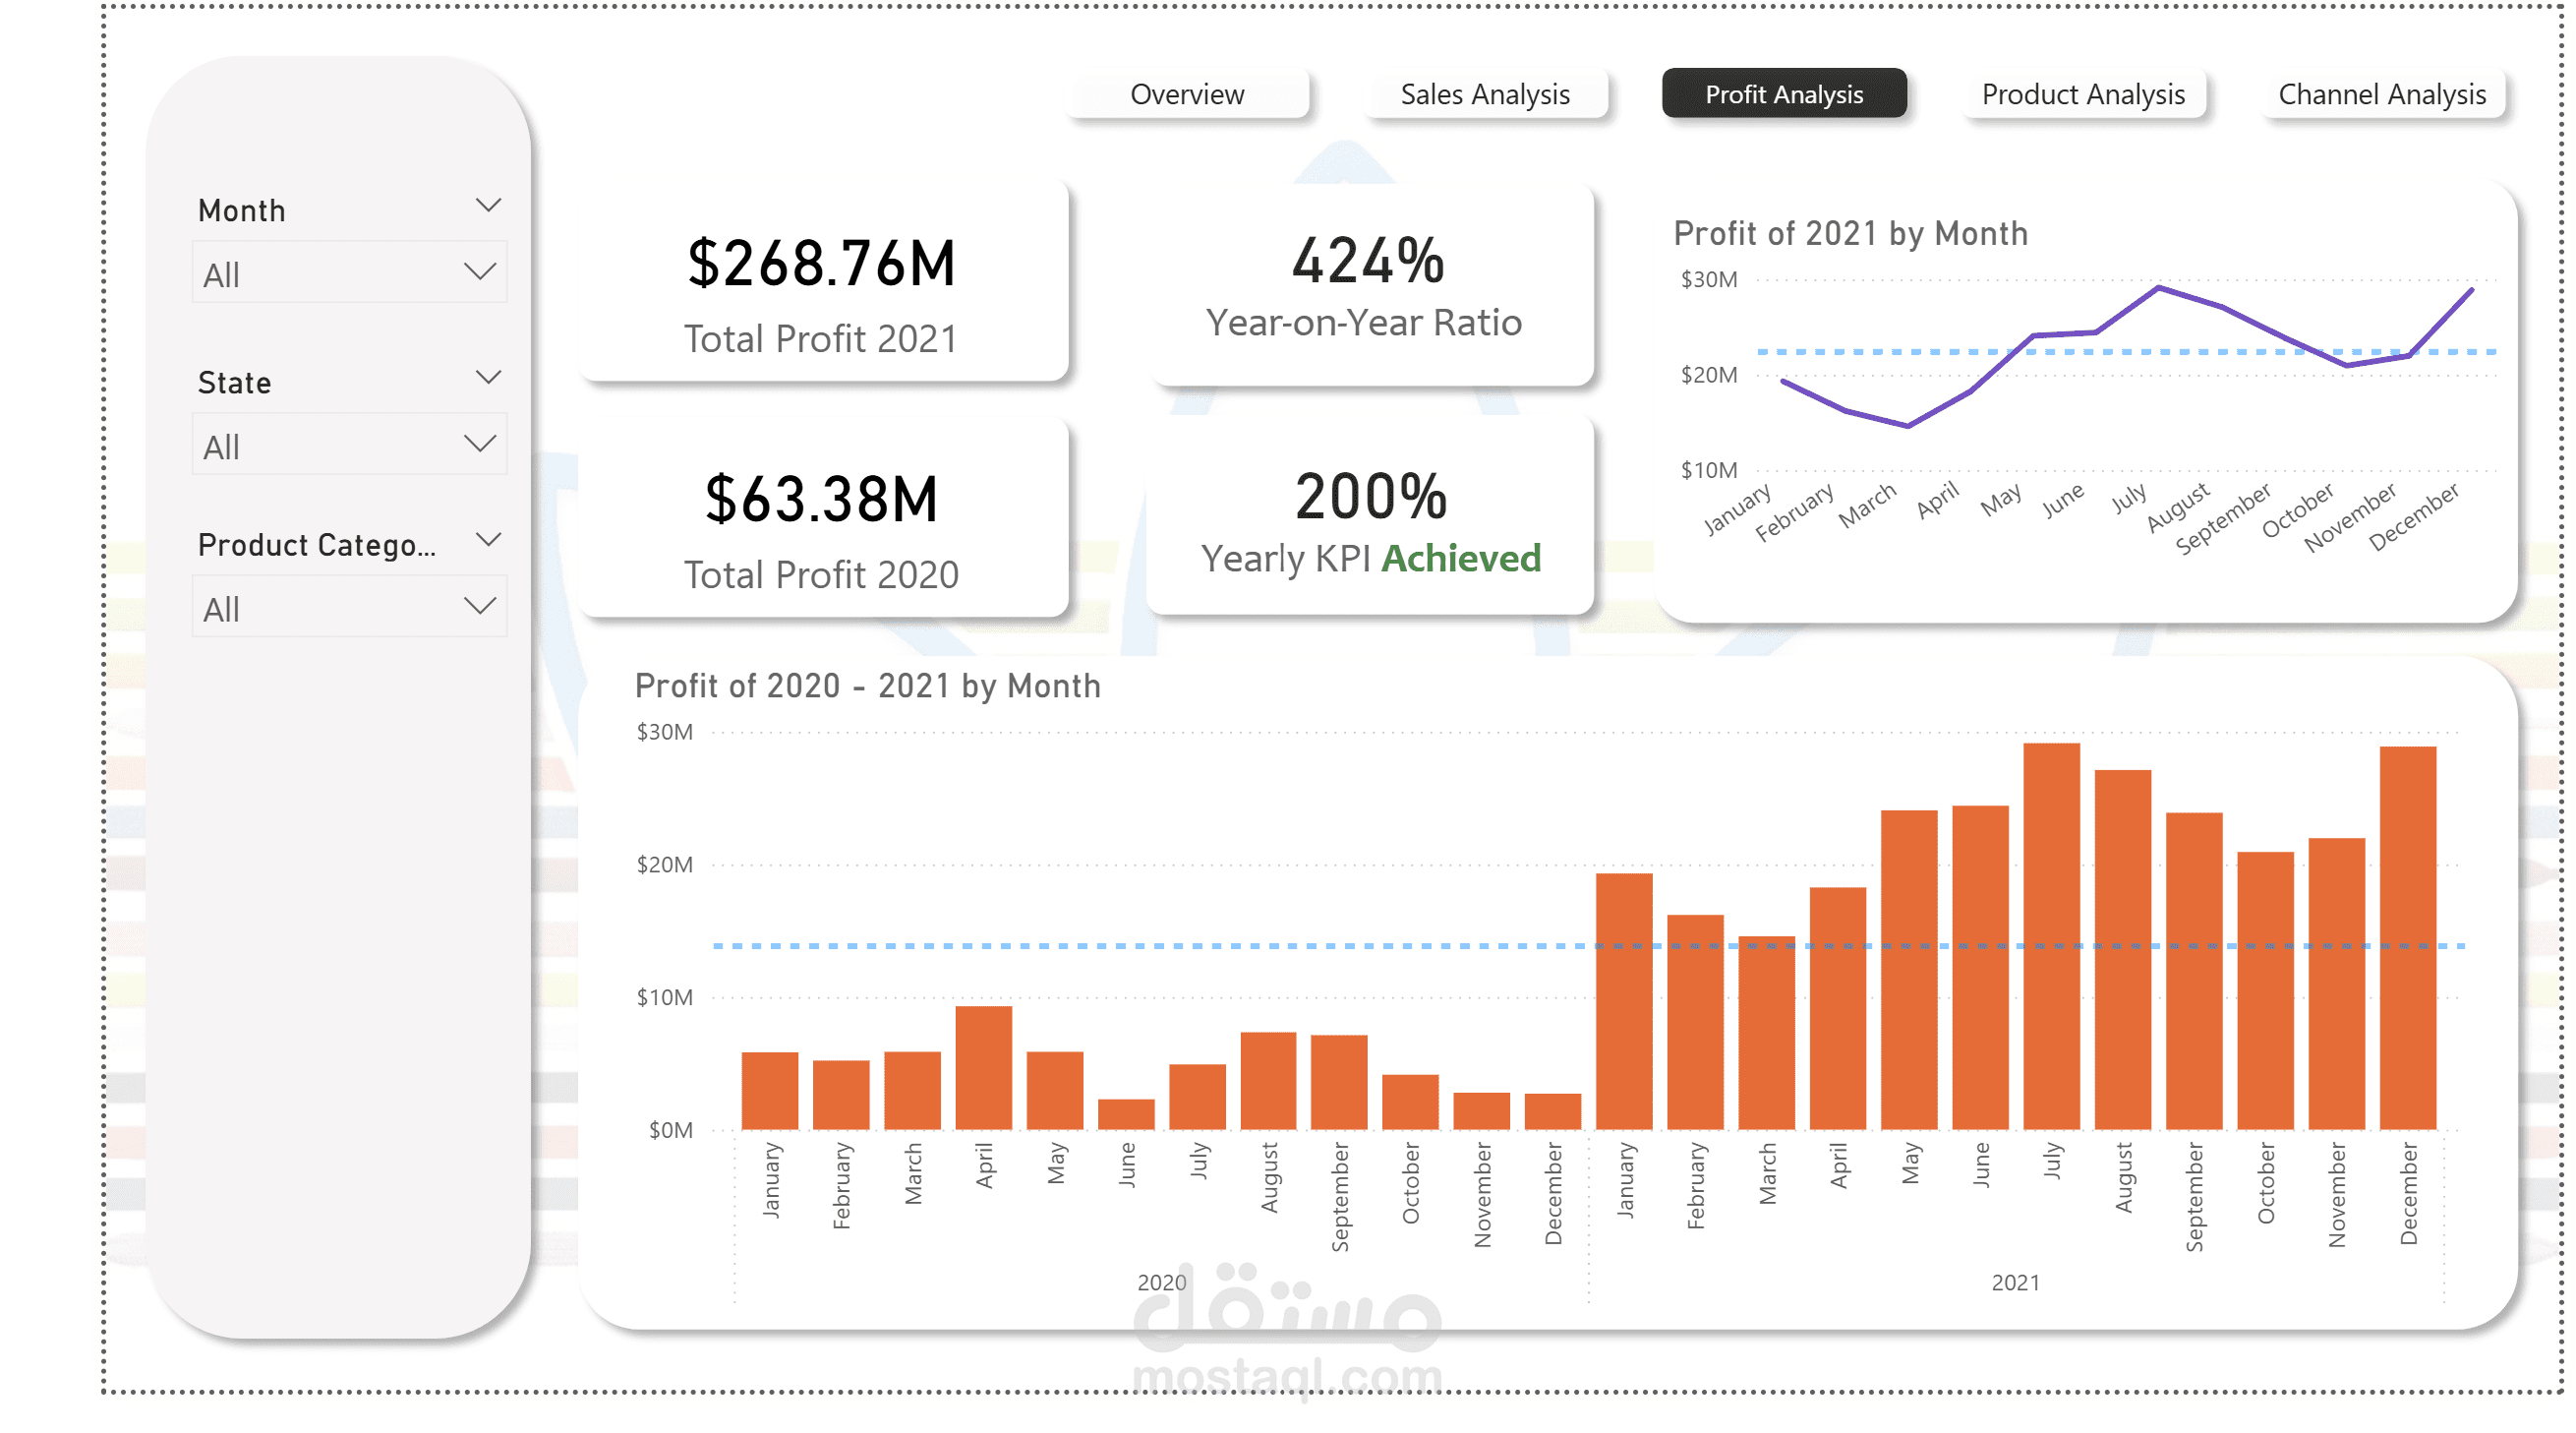
Financial KPIs: Tracked $717.8M in Total Sales and $268.7M in Profit, showcasing a 394% YoY growth.
Comprehensive Navigation: 5 dynamic pages covering Overview, Sales, Profit, Product, and Channel Analysis.
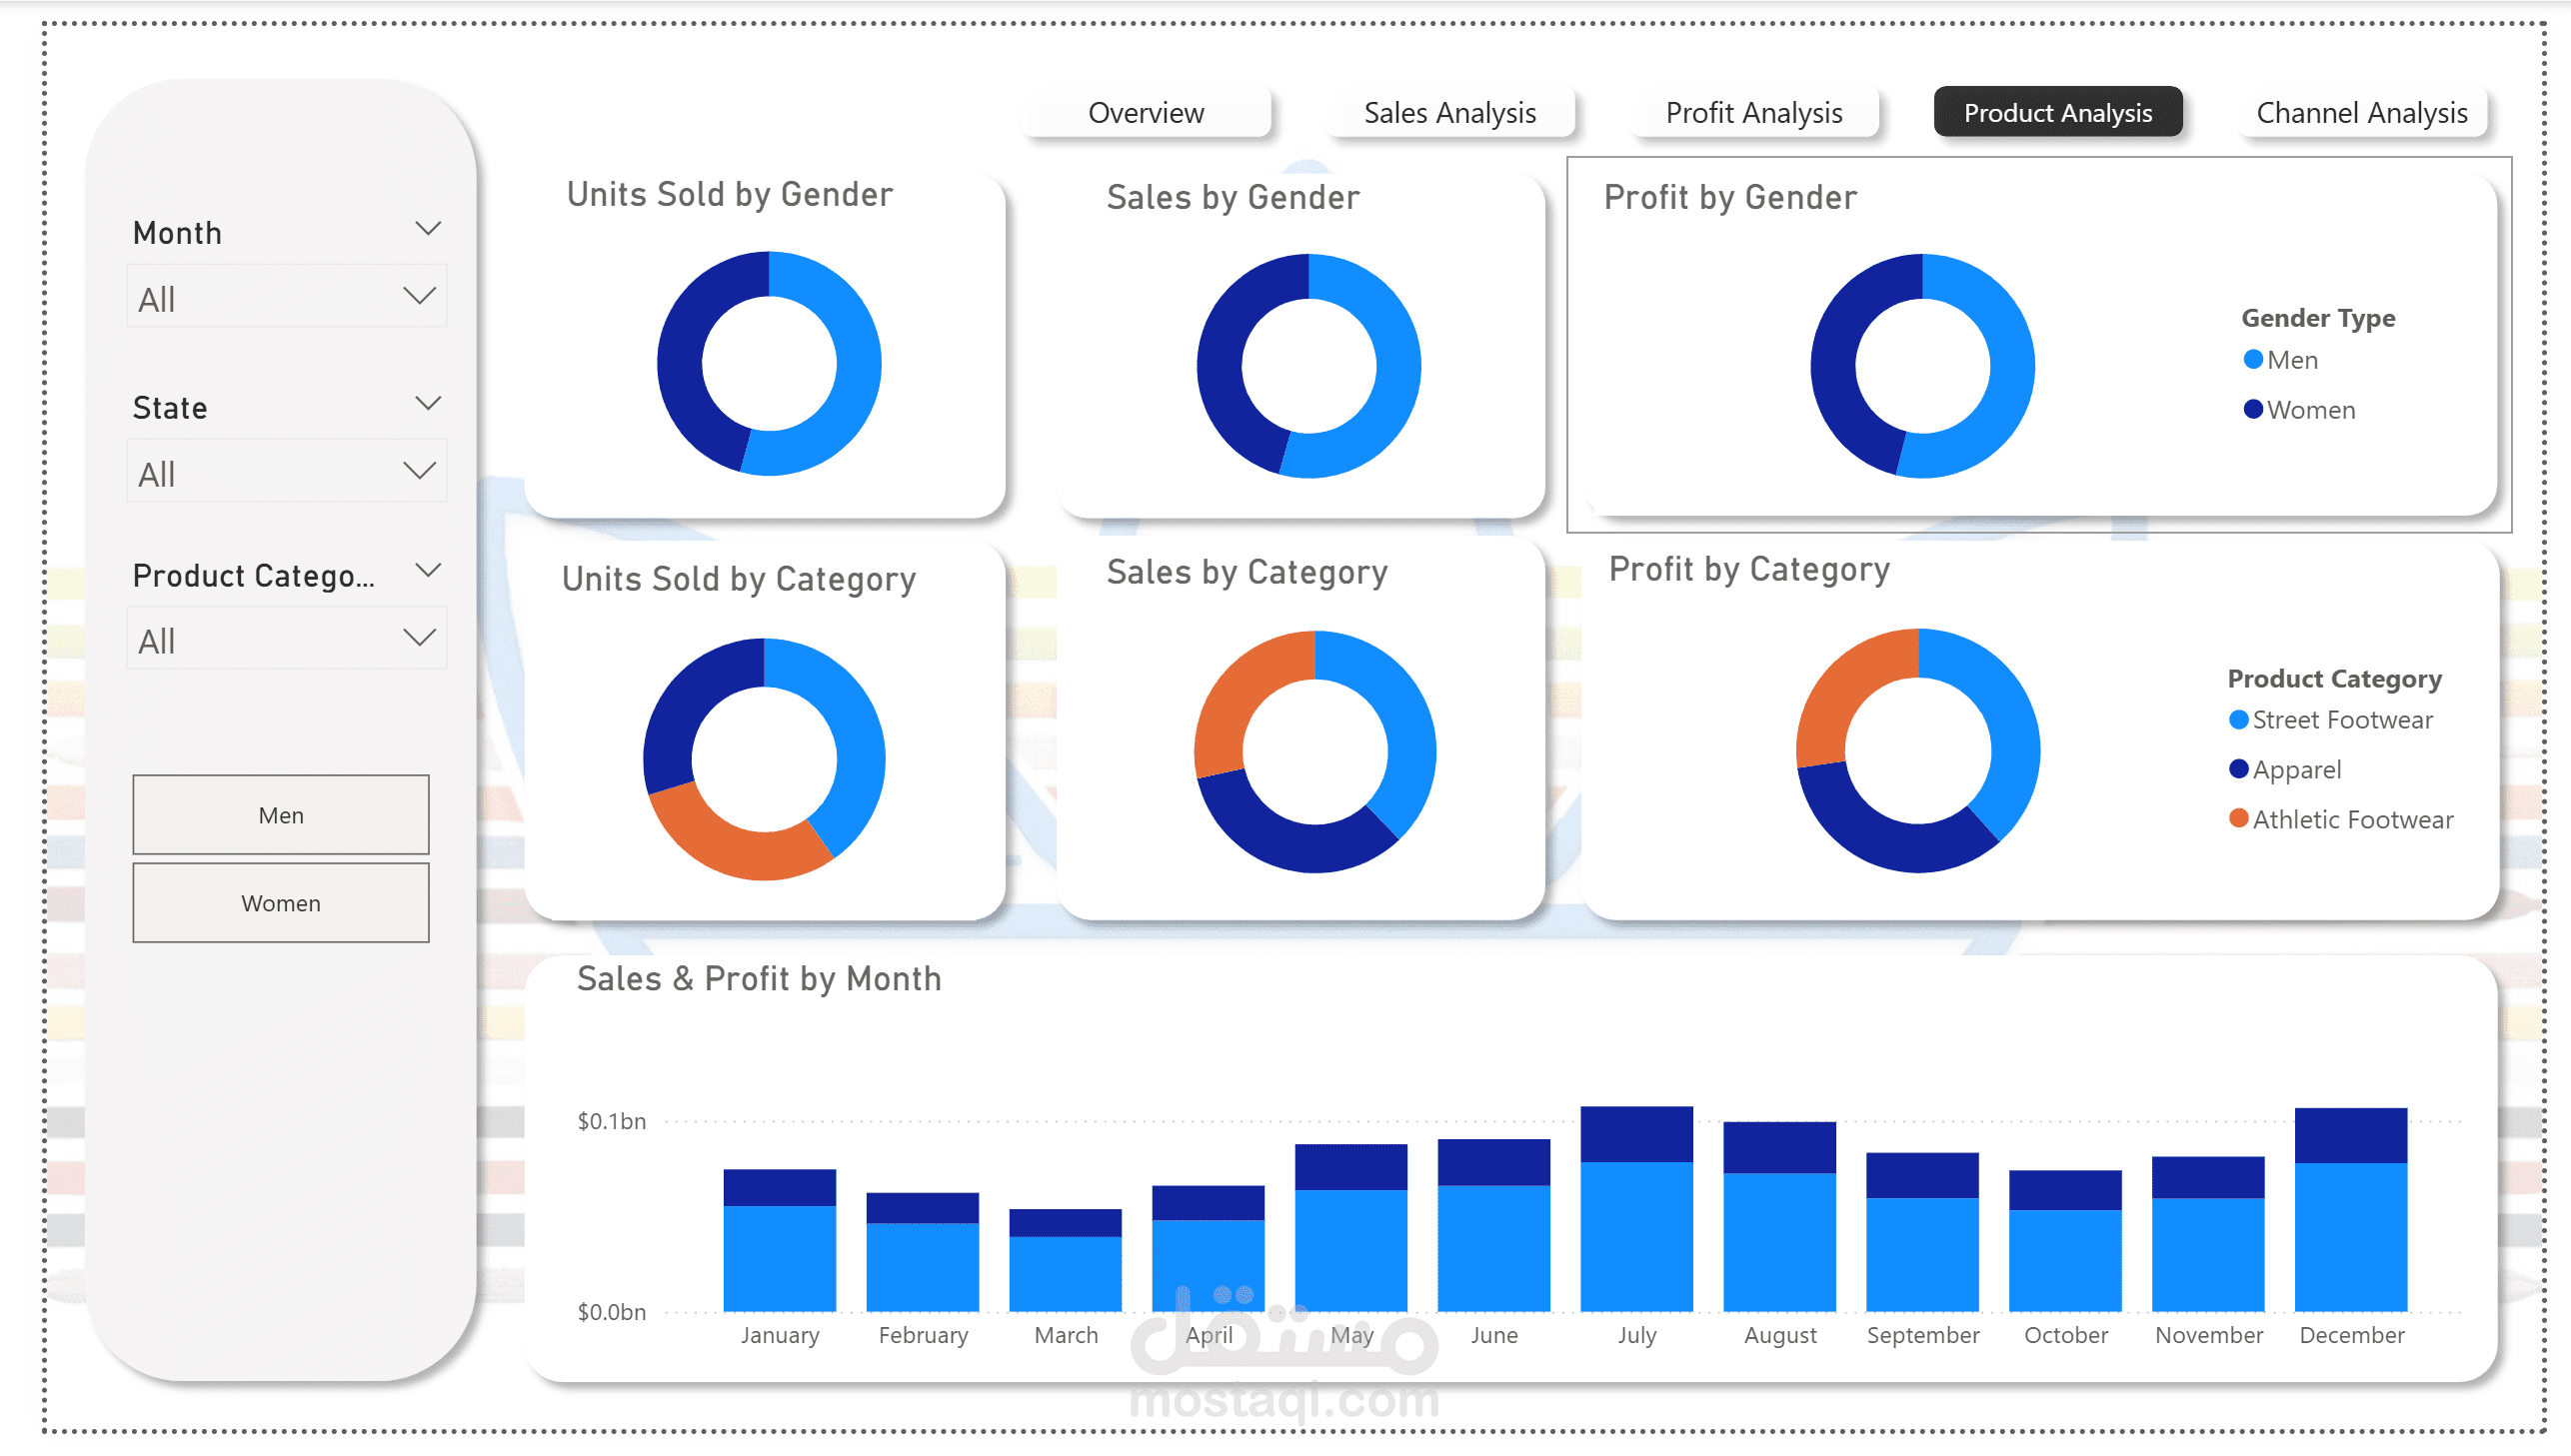
Interactive Filtering: Slicers for Month, State, and Product Category to allow customized data views.
Deep-Dive Metrics: Detailed breakdowns of sales by retailer (Amazon, Foot Locker, etc.), sales methods, and geospatial mapping across US states.
Top Performers: Identified "Street Footwear" as the most valuable and profitable category.
Tools Used: Power BI, Power Query, DAX, Data Visualization.