Toys Store Analysis
تفاصيل العمل

# ? Maven Toys Sales Analysis Dashboard
## ? Project Overview
This project presents an interactive sales analysis dashboard built using Power BI, based on the Maven Analytics dataset. The goal is to analyze business performance, track key metrics, and provide insights into revenue, profit, and sales trends.
---
## ? Dataset
* Source: Maven Analytics
* The dataset consists of **5 related tables** including sales, products, stores, and calendar data.
* Relationships were created between tables to build a proper data model.
---
## ?️ Data Preparation
* Cleaned and transformed raw data using Power BI Power Query
* Fixed data types for accurate calculations
* Built relationships between tables (data modeling)
* Created calculated columns for:
* Total Revenue
* Total Profit
---
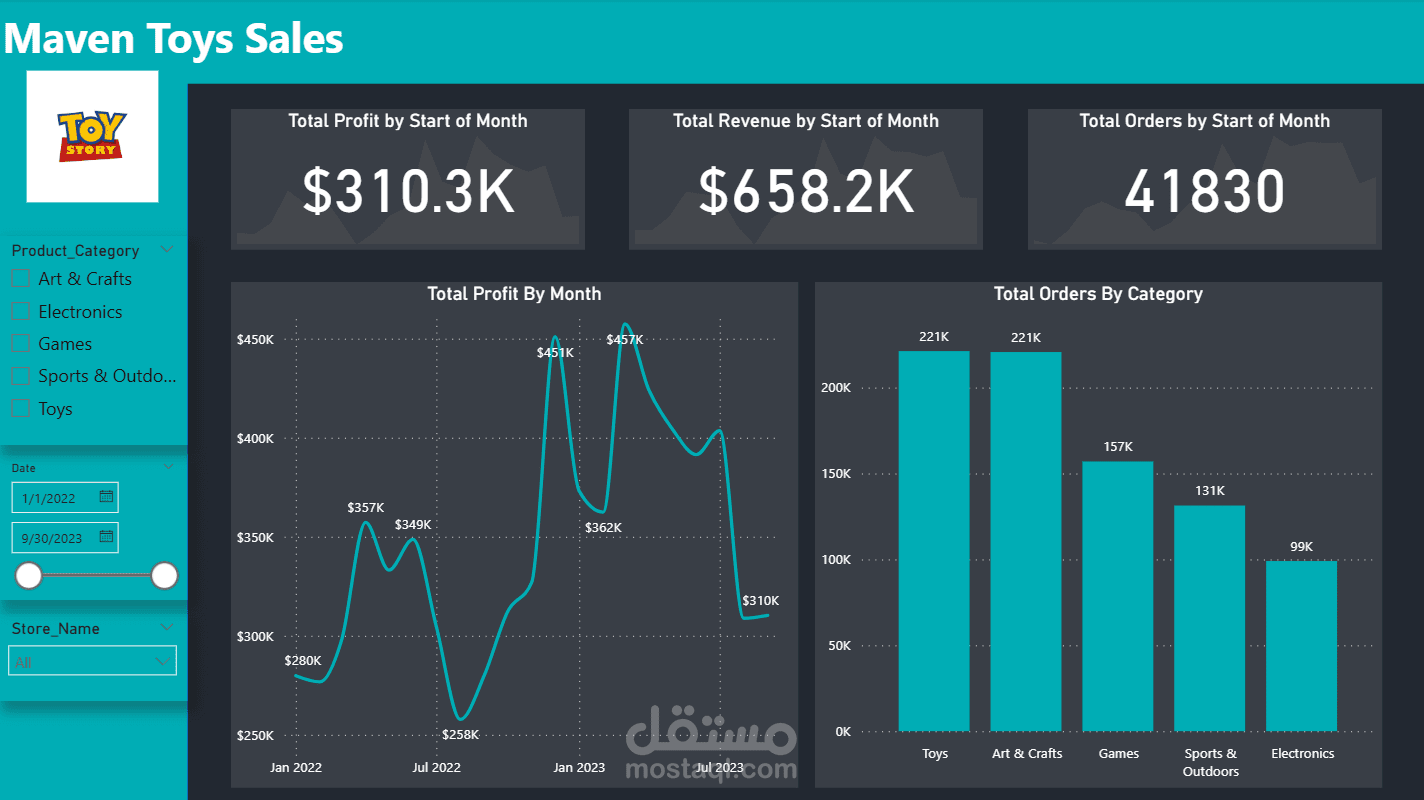
## ? Dashboard Features
The dashboard includes:
* ? **Total Revenue KPI**
* ? **Total Profit KPI**
* ? **Total Orders KPI**
* ? Profit trend over time (monthly analysis)
* ? Revenue trend over time
* ?️ Orders breakdown by product category
* ? Interactive filters:
* Product Category
* Date Range
* Store Name
---
## ? Key Insights
* Toys and Art & Crafts categories generate the highest number of orders.
* Electronics category shows the lowest performance in terms of sales.
* Profit fluctuates over time, indicating seasonality in sales.
* Significant growth observed at the بداية 2023 followed by a decline.
---
## ? Tools Used
* Power BI
* Power Query
* DAX (for calculated columns and KPIs)
* Data Modeling
---
## ? Conclusion
This dashboard helps stakeholders understand sales performance and make data-driven decisions by identifying top-performing categories, tracking trends, and monitoring key KPIs.