Pizza sales analysis
تفاصيل العمل
Pizza Sales Analysis
A data analysis project exploring sales trends, customer behavior, and revenue insights from a pizza restaurant's order records over a full year.
Project Overview
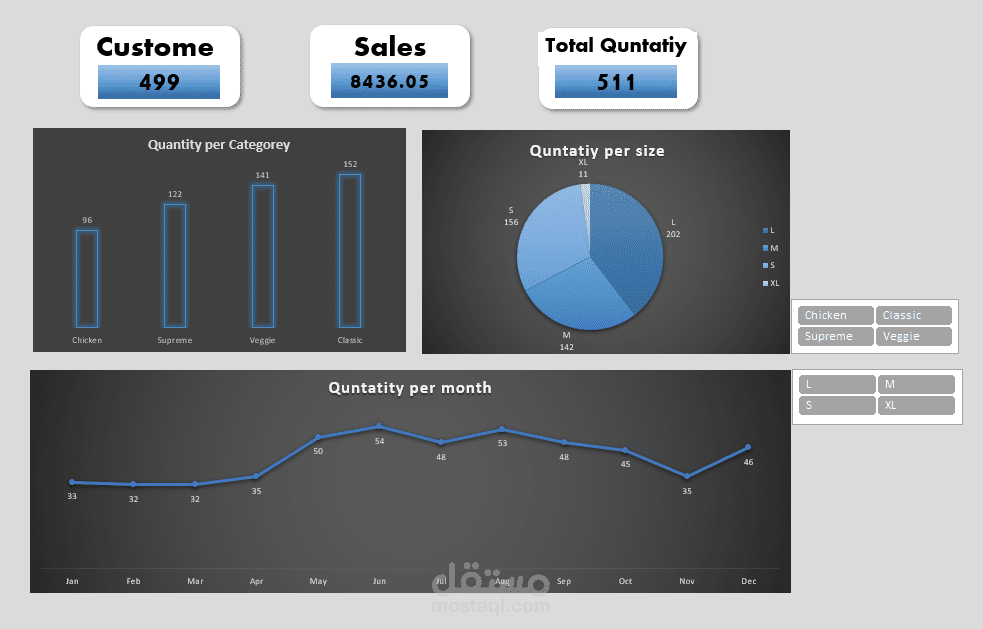
This project analyzes a dataset of **499 pizza orders** containing detailed transaction records including customer names, pizza types, sizes, categories, ingredients, order dates/times, and pricing. The goal is to uncover actionable business insights such as peak sales periods, best-selling products, and revenue distribution.
Dataset
**File:** `Pizza_sales_.xlsx`
Sheets:
- `Data` — Raw transaction records (499 rows)
- `Pivot tables` — Pre-built aggregations by category, size, and month
- `My Dashboard` — Visual summary of key metrics
Columns:
| Column | Description |
|---|---|
| `order_id` | Unique order identifier |
| `pizza_id` | Pizza product code |
| `Customer Name` | Name of the customer |
| `quantity` | Number of pizzas ordered |
| `order_date` | Date of the order |
| `order_time` | Time of the order |
| `unit_price` | Price per pizza |
| `total_price` | Total order price |
| `pizza_size` | Size: S, M, L, XL |
| `pizza_category` | Category: Classic, Chicken, Veggie, Supreme |
| `pizza_ingredients` | List of ingredients |
| `pizza_name` | Full name of the pizza |
Key Metrics
| Metric | Value |
|---|---|
| Total Orders | 499 |
| Total Pizzas Sold | 511 |
| Total Revenue | **$8,436.05** |
| Date Range | Full calendar year (Jan–Dec) |
Insights from the Data
### Sales by Category
| Category | Qty Sold |
|---|---|
| Classic | 152 |
| Veggie | 141 |
| Supreme | 122 |
| Chicken | 96 |
### Sales by Size
| Size | Qty Sold |
|---|---|
| S (Small) | 156 |
| L (Large) | 202 |
| M (Medium) | 142 |
| XL | 11 |
Monthly Trends
Peak sales months were **May, June, and August**, while January, February, and November saw the lowest order volumes.
Tools Used
- **Microsoft Excel** — Data storage, pivot tables, and dashboard
- *(Optional additions)* Python / Pandas for further analysis
- *(Optional additions)* Power BI / Tableau for interactive visualizations
Getting Started
1. Clone or download this repository
2. Open `Pizza_sales_.xlsx` in Microsoft Excel or any compatible spreadsheet tool
3. Navigate to the **Pivot tables** sheet for summarized data
4. Navigate to the **My Dashboard** sheet for visual insights
Notes
- Dates in the raw data are stored as Excel serial numbers
- Some orders include quantities greater than 1 (multi-pizza orders)
- The `Brie Carre` pizza is the highest unit-price item at **$23.65**