Sales Performance Dashboard & Market Insights
تفاصيل العمل
Campaign Performance Dashboard
Project Description:
Designed and developed an interactive dashboard for analyzing marketing campaign performance, aimed at tracking key performance indicators (KPIs) and transforming data into actionable insights.
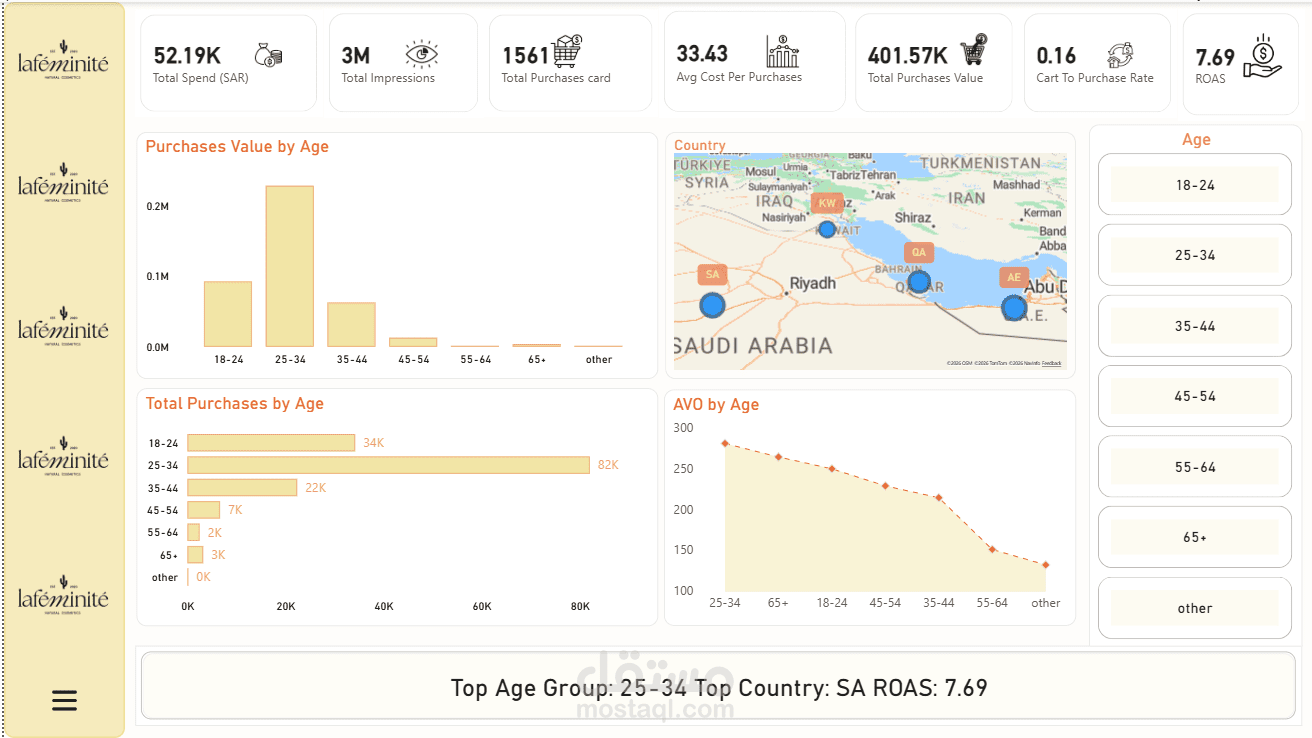
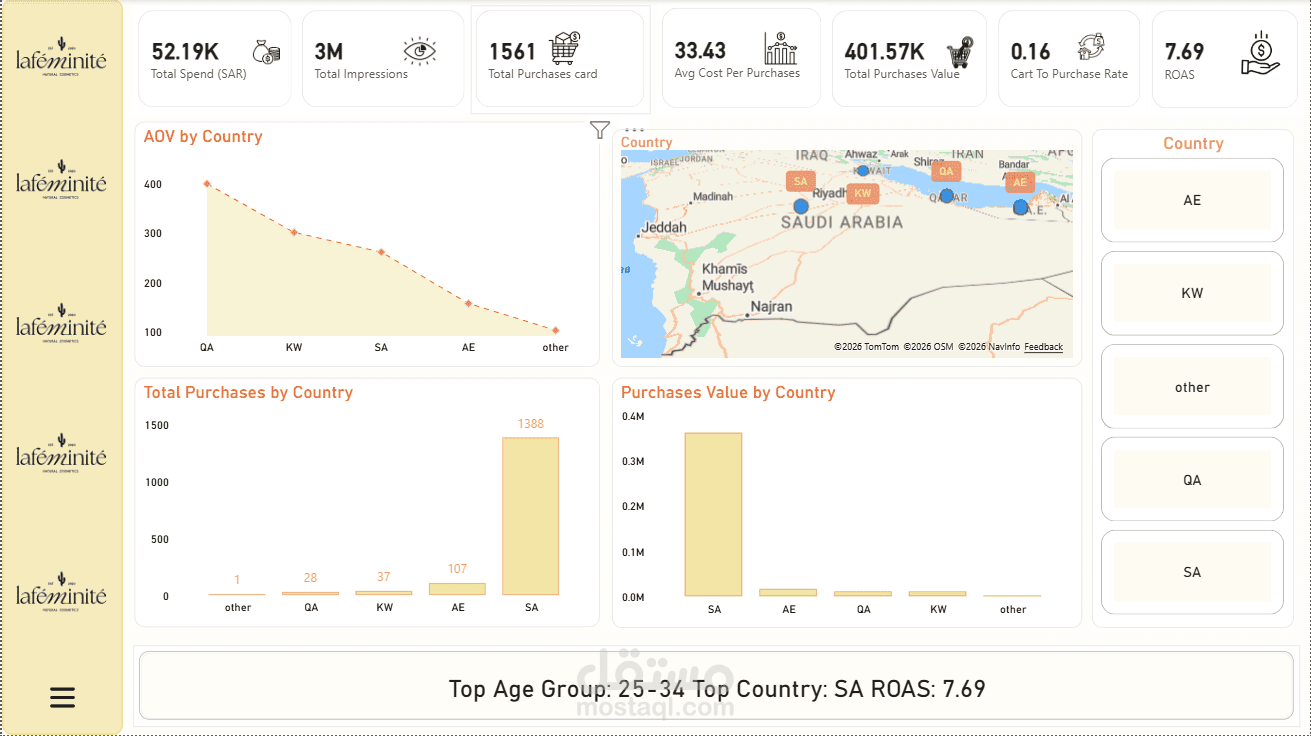
The dashboard provides a comprehensive analysis of market data across multiple dimensions such as countries and age groups, enabling a deeper understanding of customer behavior and supporting data-driven marketing strategies.
Key Features:
Tracking Total Spend and Total Impressions
Monitoring Total Purchases and Purchase Value
Calculating Average Cost per Purchase
Measuring Cart to Purchase Rate
Analyzing Return on Ad Spend (ROAS)
Data Analysis:
Performance analysis by Country
Performance analysis by Age Groups
Identification of top-performing markets
Identification of the most engaged segment (Top Age Group: 25–34)
Analysis of Average Order Value (AOV) by country and age
Visualization & Insights:
Interactive maps to display geographic distribution
Use of charts (Bar, Line, KPI Cards) for clear data representation
Interactive filtering by country and age group
Highlighting key insights such as
Top Country: Saudi Arabia (SA)
Highest ROAS: 7.69
Tools & Technologies:
Power BI
Microsoft Excel
Data Cleaning & Data Transformation
Data Visualization
Project Goal:
To transform marketing data into clear, actionable insights that support:
Campaign optimization
Cost reduction
Increased return on investment (ROI)
Data-driven decision-making