Performance Analysis Dashboard Using Power BI
تفاصيل العمل

يعرض هذا المشروع لوحة معلومات (Dashboard) تفاعلية تم تصميمها باستخدام Power BI لتحليل أداء الطلاب من عدة جوانب مختلفة. توفر اللوحة رؤى واضحة حول أهم المؤشرات الأكاديمية، مثل المعدل التراكمي (GPA)، معدل النجاح، وتوزيع الطلاب.
وتتضمن اللوحة مجموعة من التصورات البيانية التي توضح:
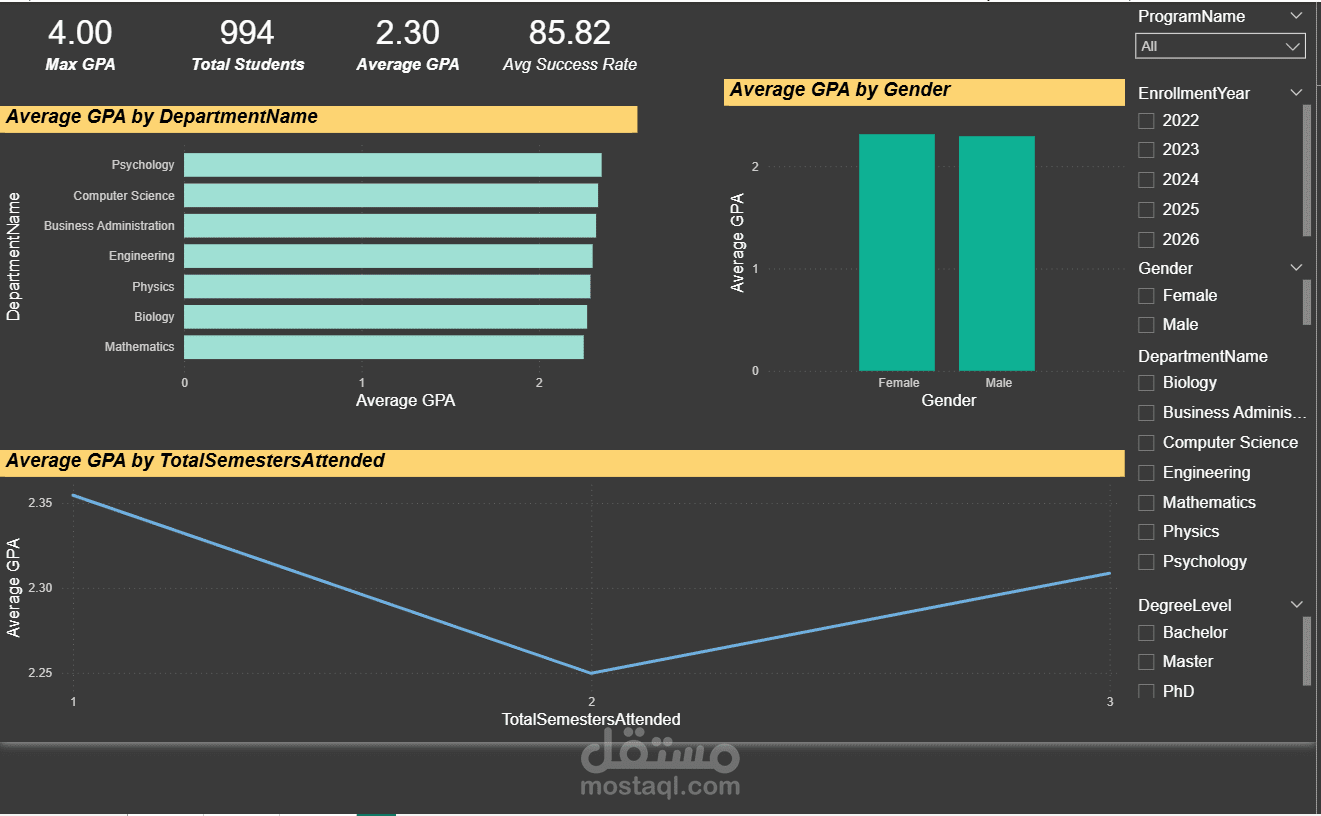
متوسط المعدل التراكمي (GPA) عبر الأقسام المختلفة مثل الهندسة، وإدارة الأعمال، وعلم النفس.
مقارنة المعدل التراكمي بين الذكور والإناث.
العلاقة بين المعدل التراكمي وعدد الفصول الدراسية التي أكملها الطالب.
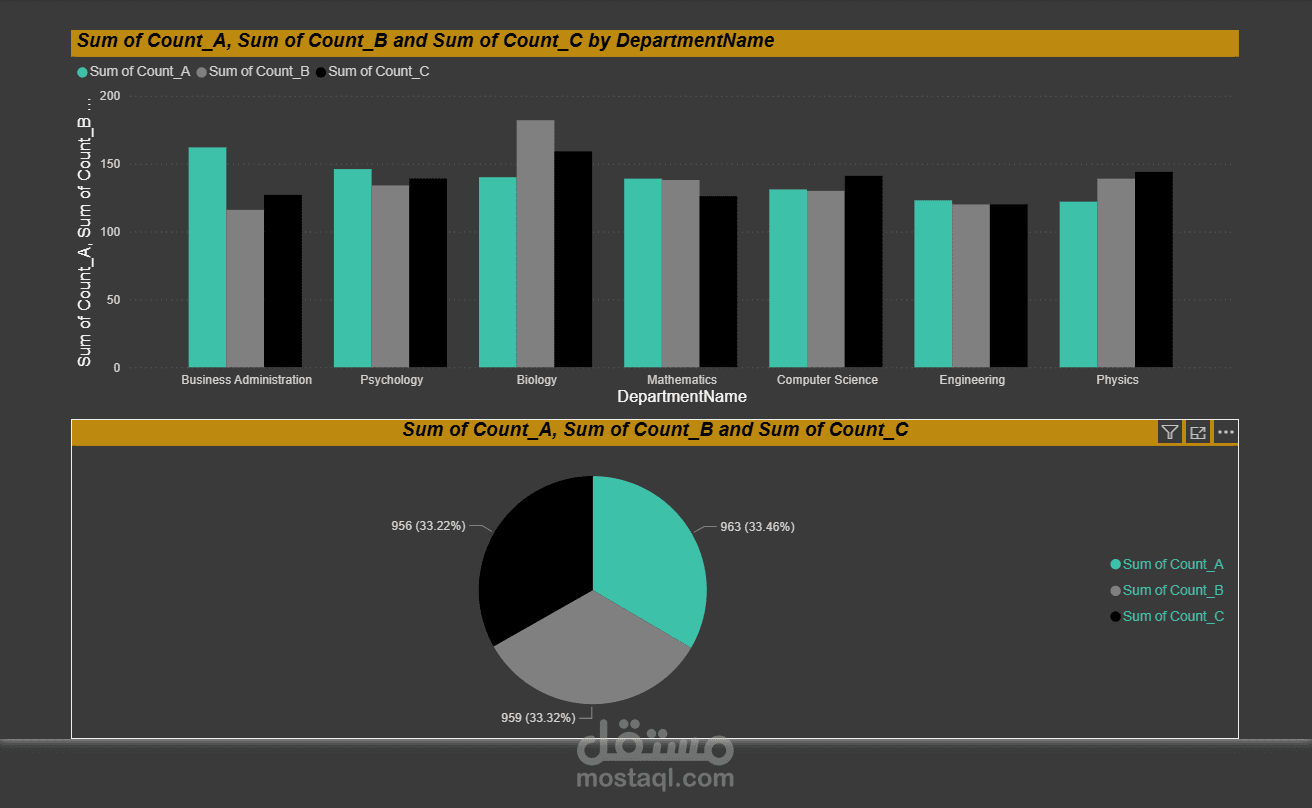
توزيع مؤشرات أداء المقررات الدراسية (عدد التقديرات A وB وC).
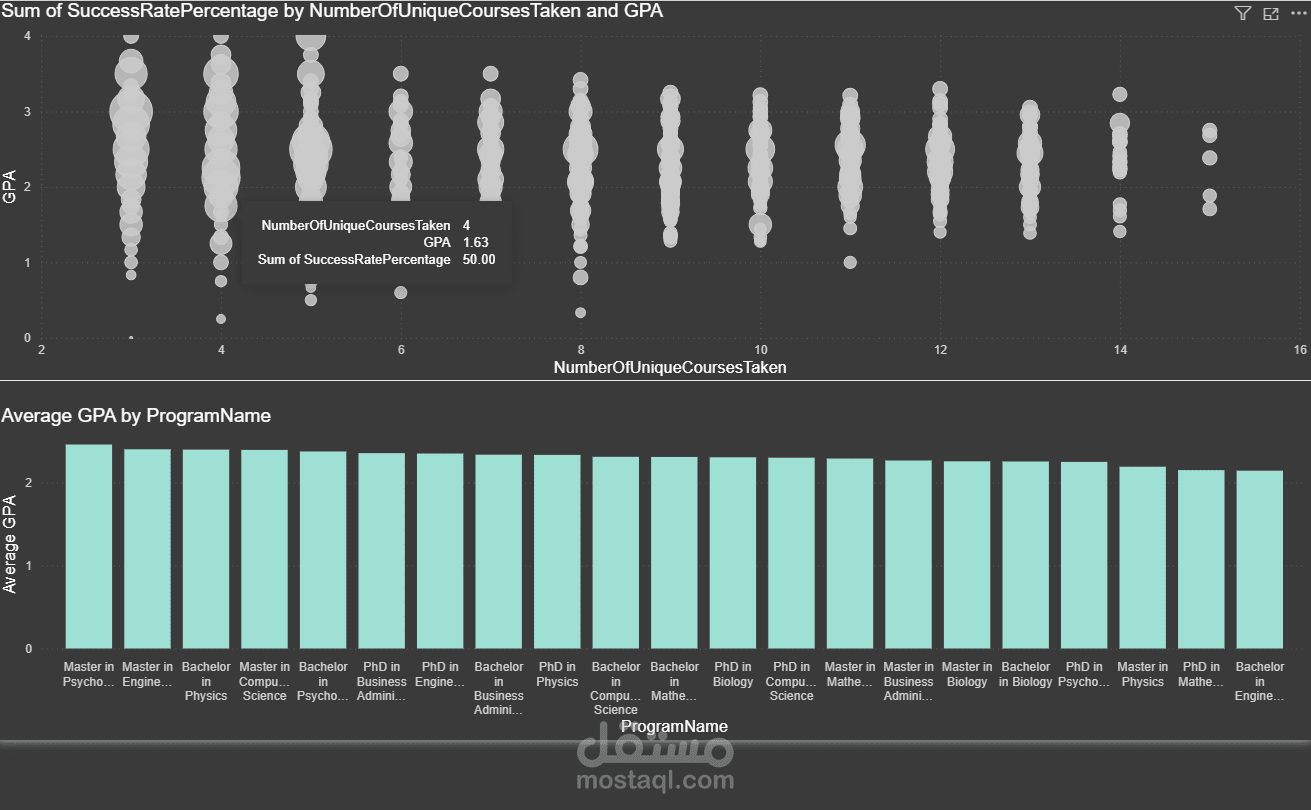
تأثير عدد المقررات الفريدة التي درسها الطالب على معدل النجاح.
اتجاهات المعدل التراكمي عبر البرامج الأكاديمية ومستويات الدرجات العلمية المختلفة.
كما تتضمن لوحة المعلومات فلاتر تفاعلية (Slicers) مثل:
سنة الالتحاق.
الجنس.
القسم الأكاديمي.
المستوى أو الدرجة العلمية.
مما يتيح للمستخدمين استكشاف البيانات بشكل تفاعلي واكتشاف الأنماط والمؤشرات المهمة بسهولة.
بشكل عام، يساعد هذا المشروع في تحديد اتجاهات الأداء الأكاديمي، ومقارنة نتائج الطلاب، ودعم اتخاذ القرارات المبنية على البيانات داخل المؤسسات التعليمية.