تحليل بيانات
تفاصيل العمل
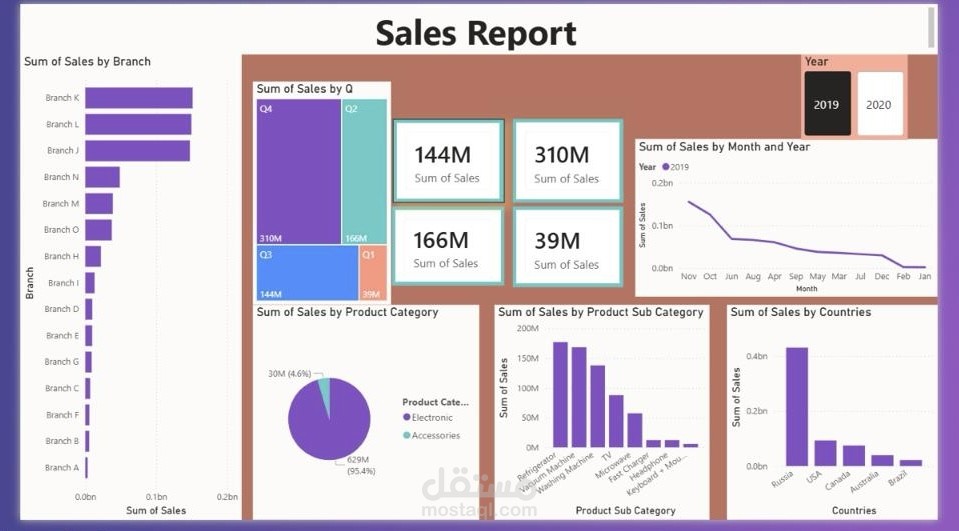
Project Description: Sales Dashboard Analysis
This project presents a comprehensive Sales Dashboard built to analyze and visualize sales performance across multiple dimensions. The dashboard provides clear insights into sales trends, product performance, and regional distribution.
Using Microsoft Excel (Pivot Tables & Power Query), I cleaned, transformed, and structured the data to ensure accuracy and consistency. Then, I designed an interactive dashboard that allows users to easily explore key metrics and make data-driven decisions.
Key Features:
* Analysis of total sales by branches, countries, and product categories
* Quarterly and monthly sales trend visualization
* Identification of top-performing product sub-categories
* Interactive filters (e.g., year selection) for dynamic analysis
* Clear KPI cards showing overall sales performance
Tools Used:
* Microsoft Excel
* Power Query
* Pivot Tables & Charts
Outcome:
The dashboard simplifies complex sales data into actionable insights, helping stakeholders track performance, identify opportunities, and improve decision-making.