AdventureWorks Sales Analysis Dashboard | Pow ?
تفاصيل العمل
? Key Insights :
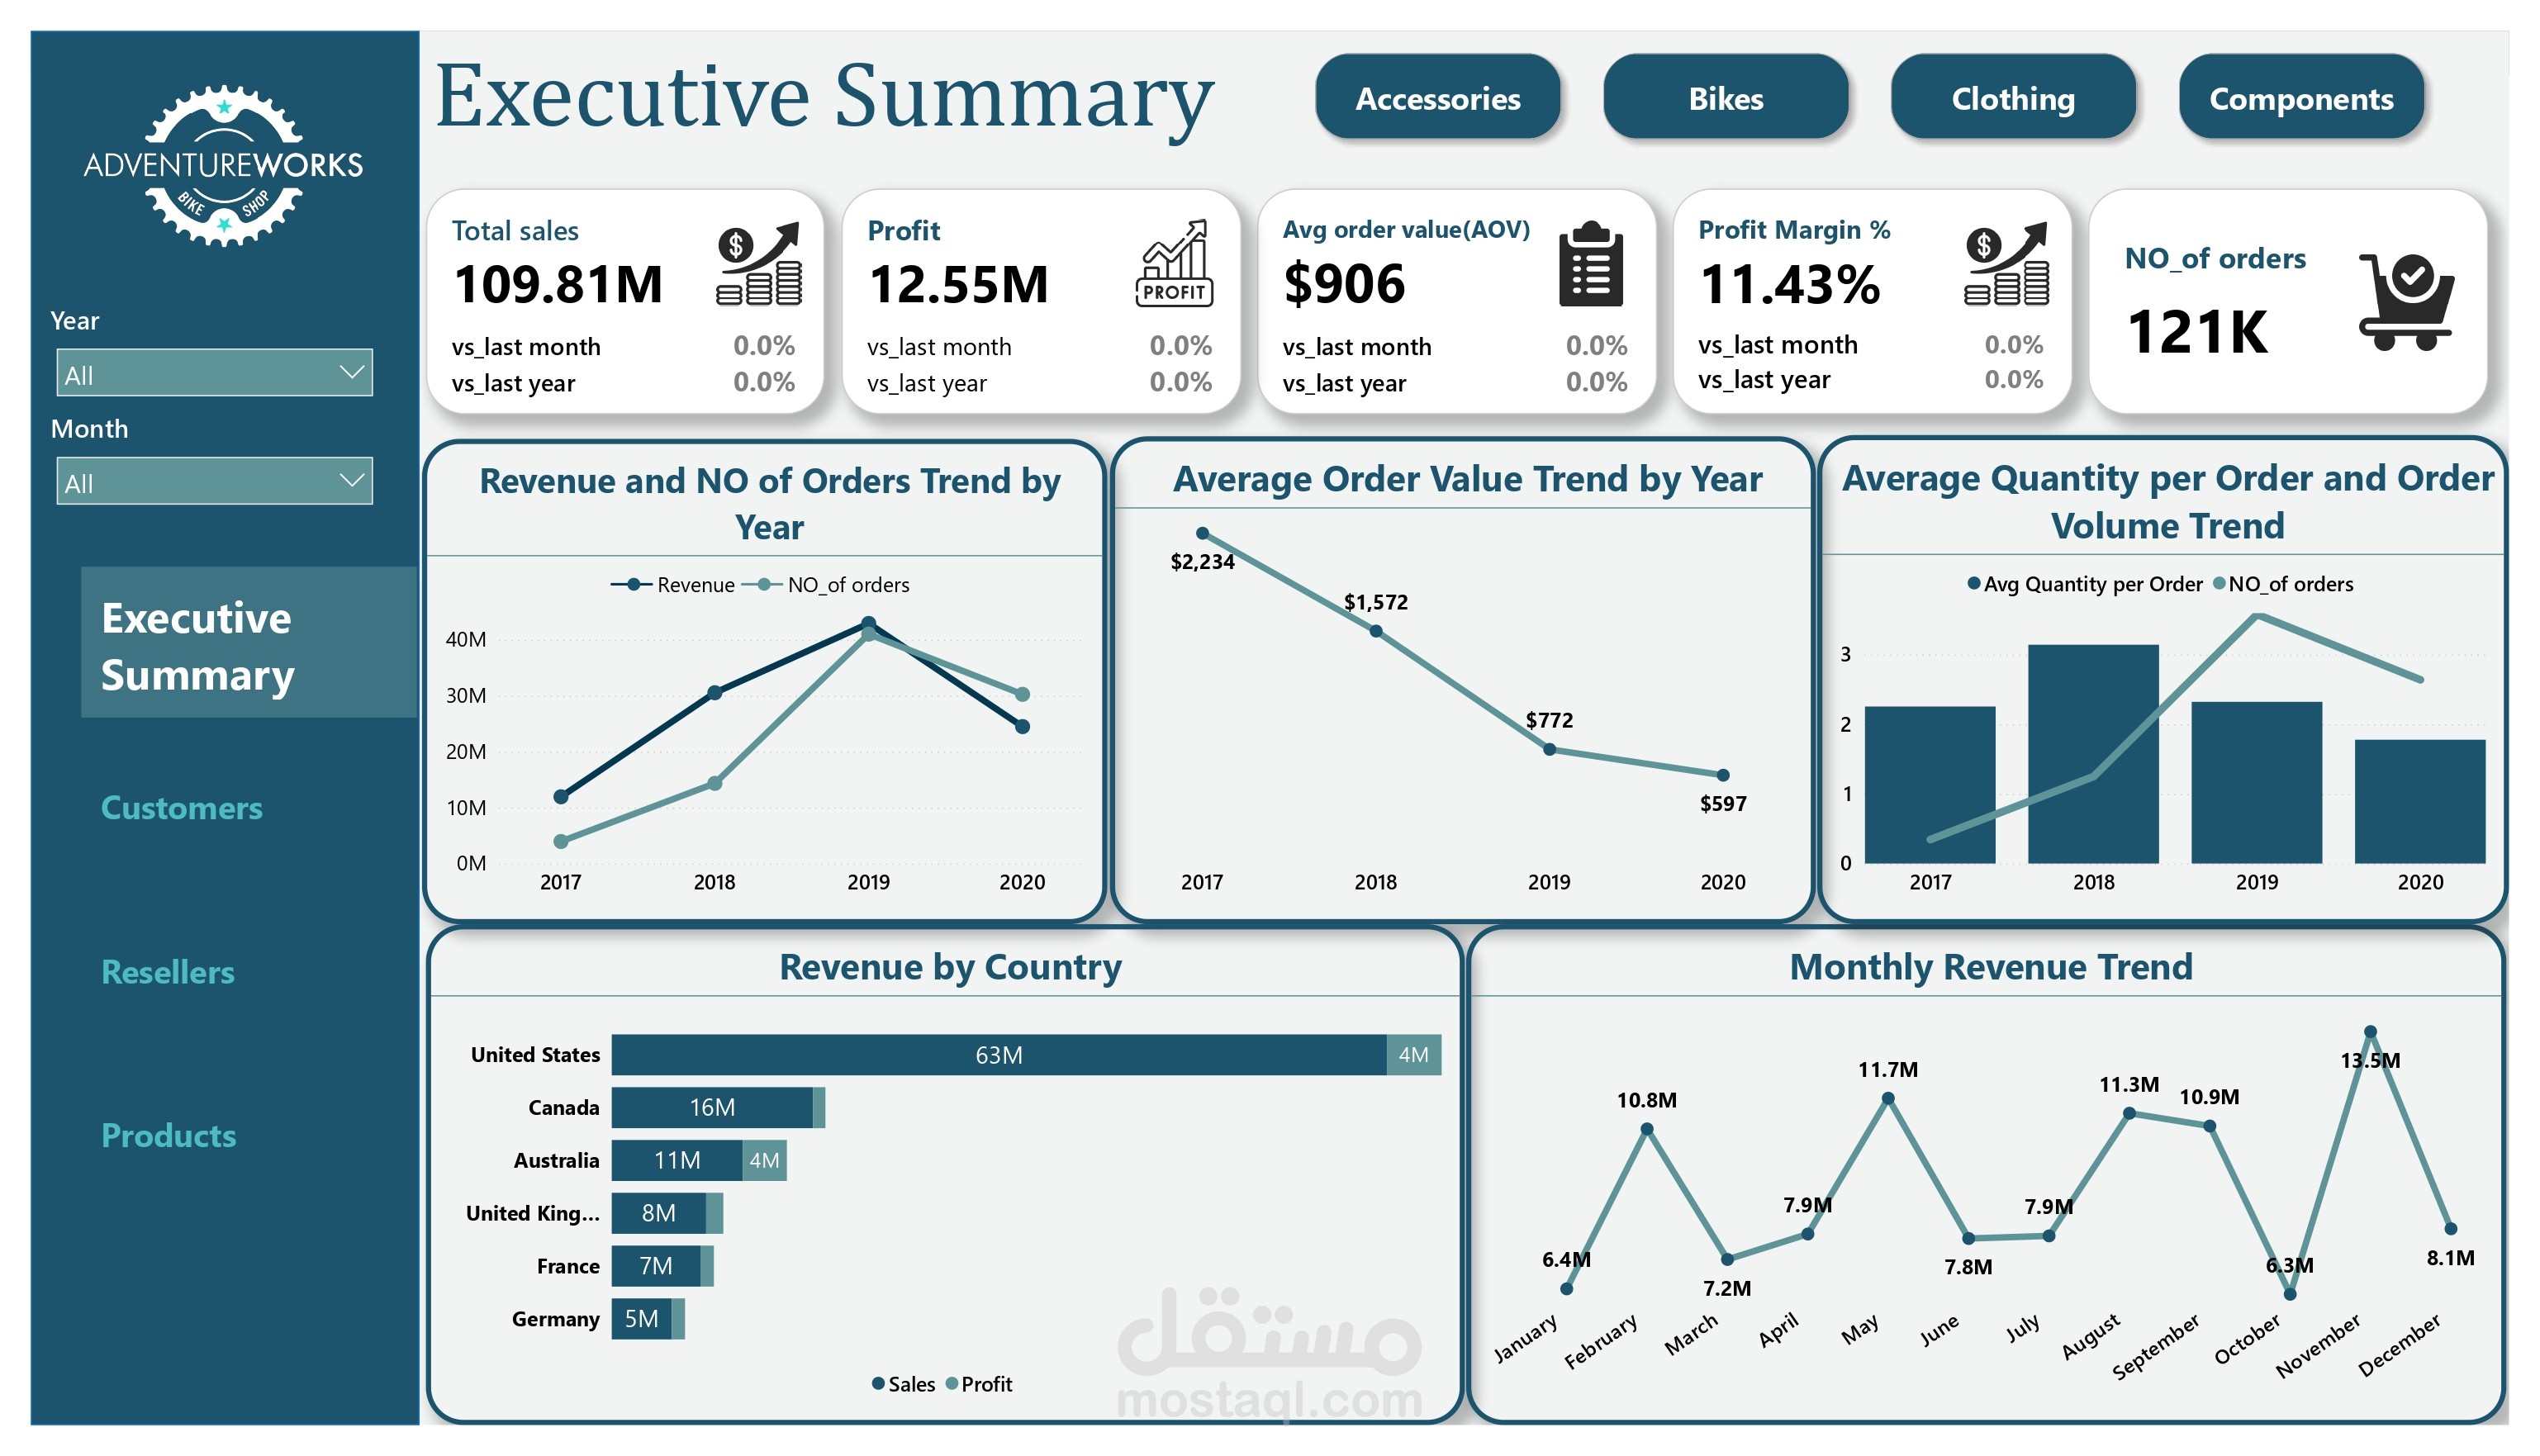
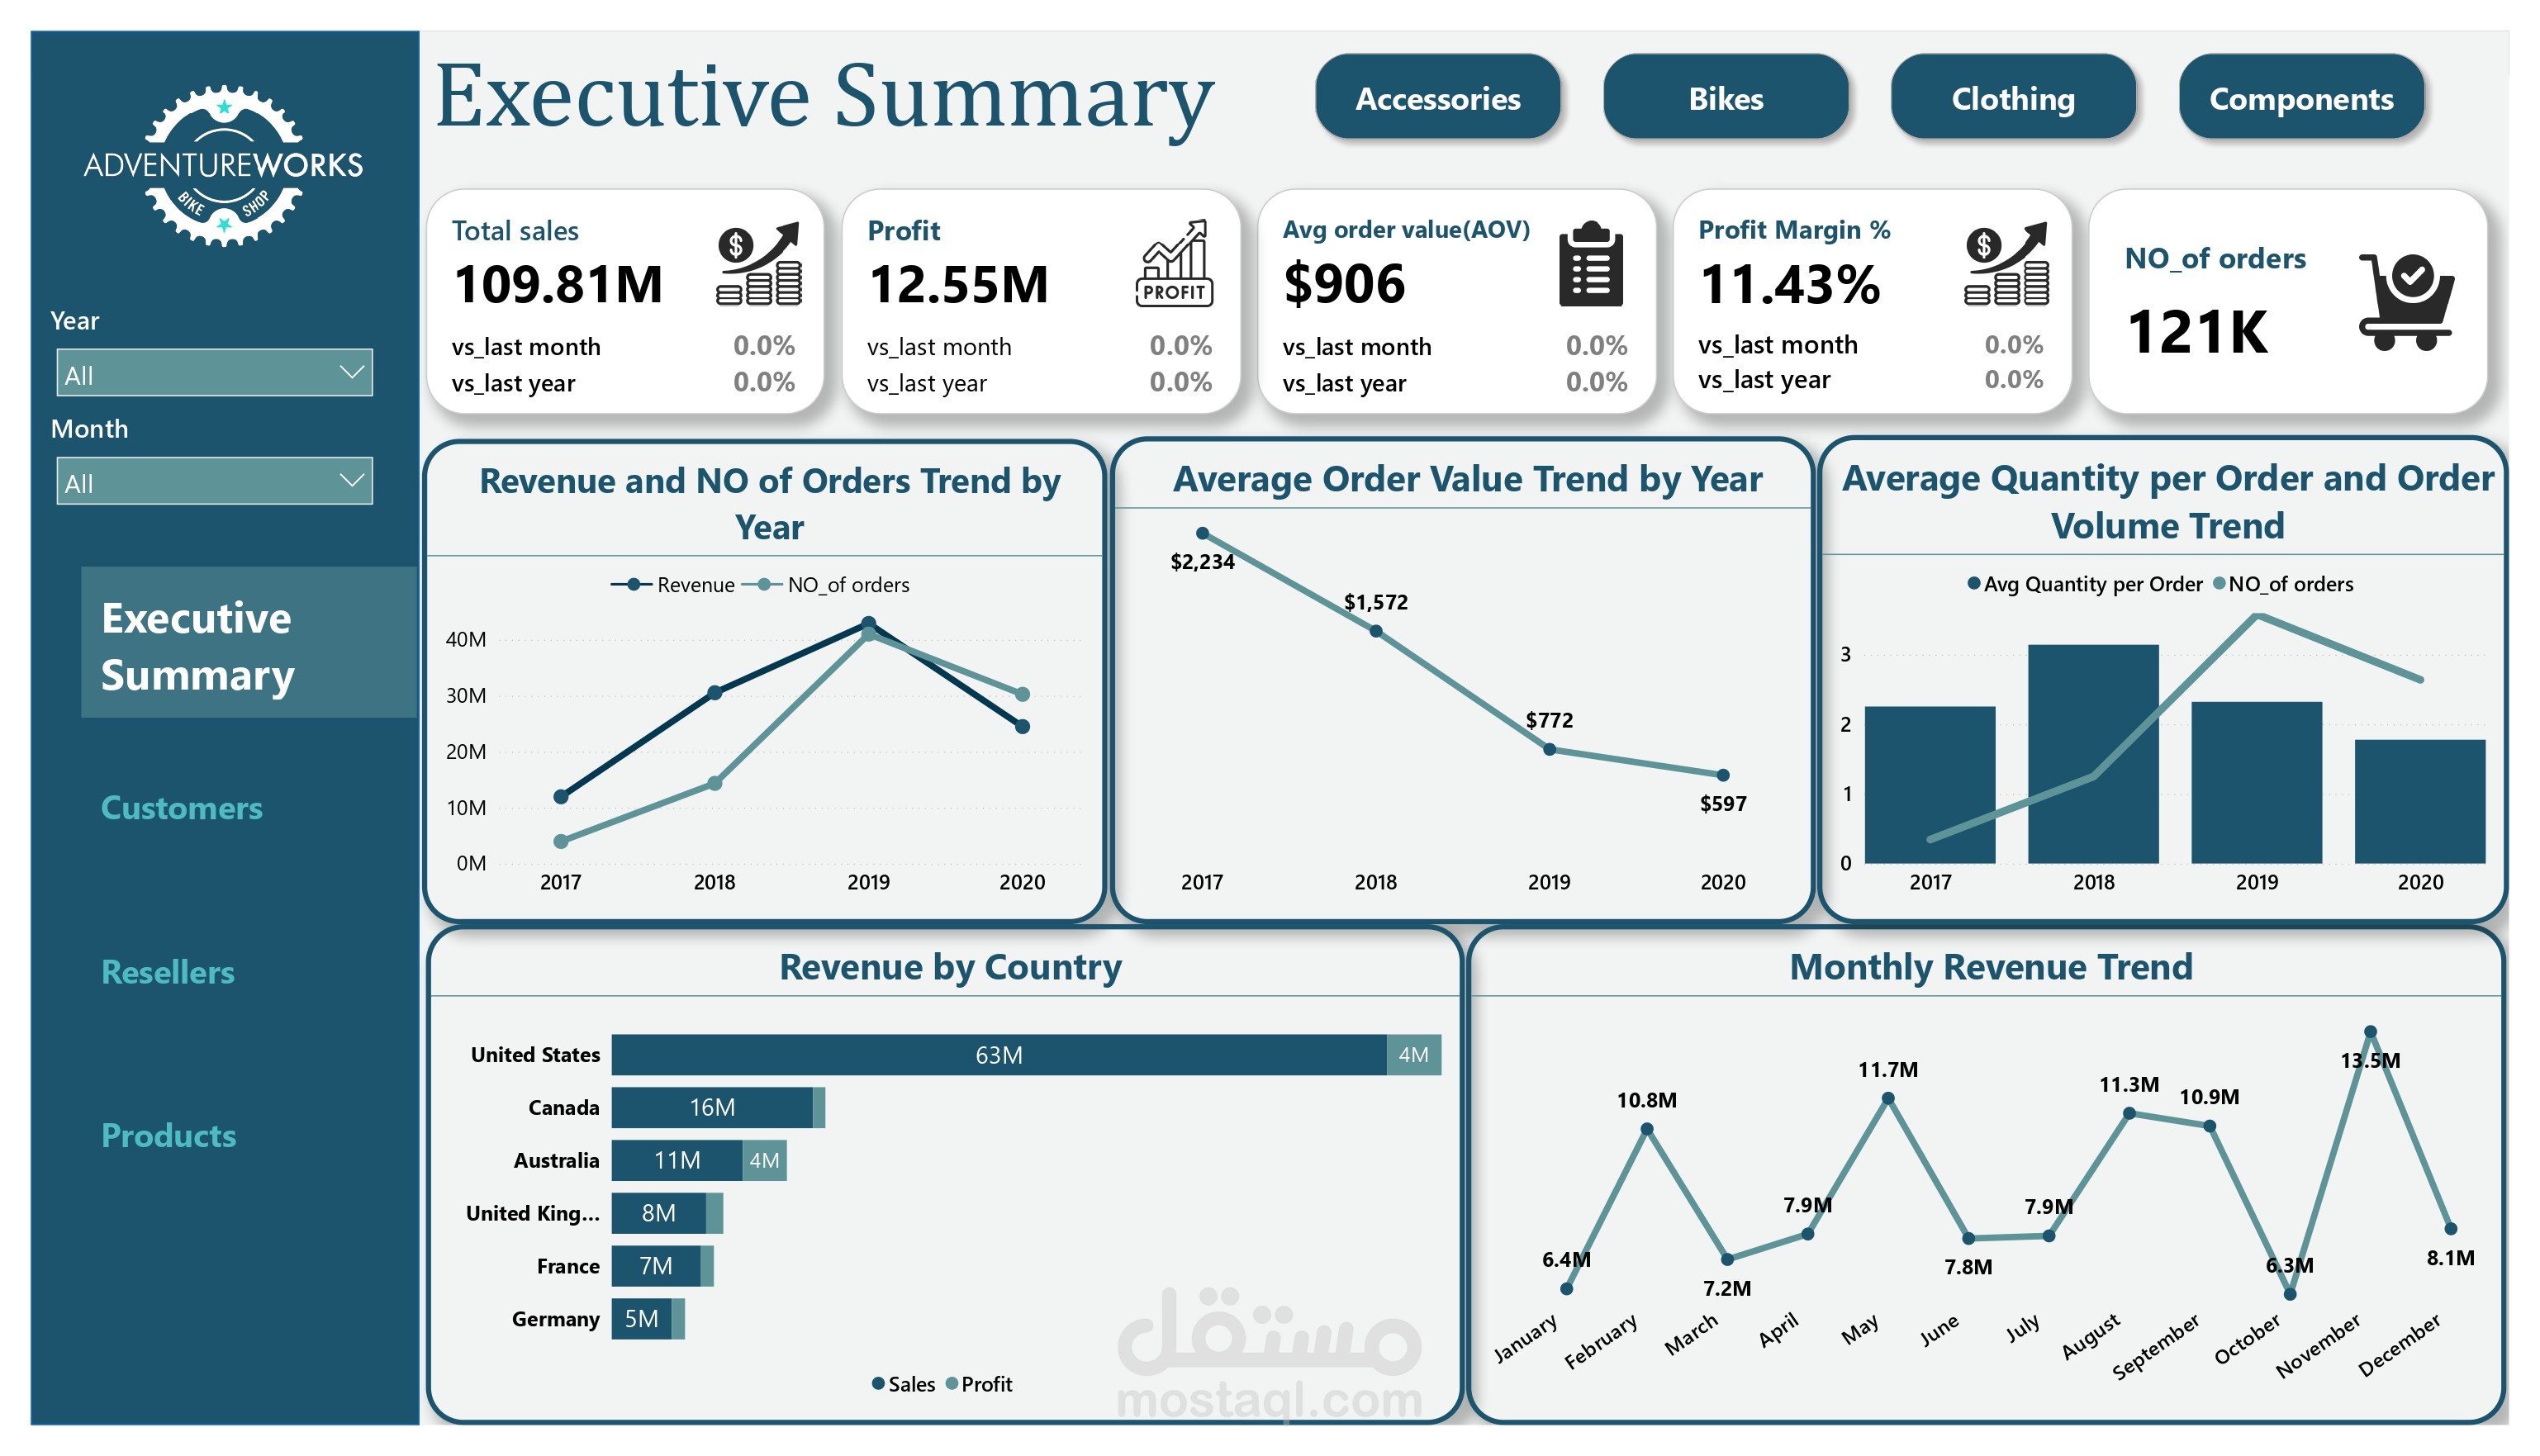
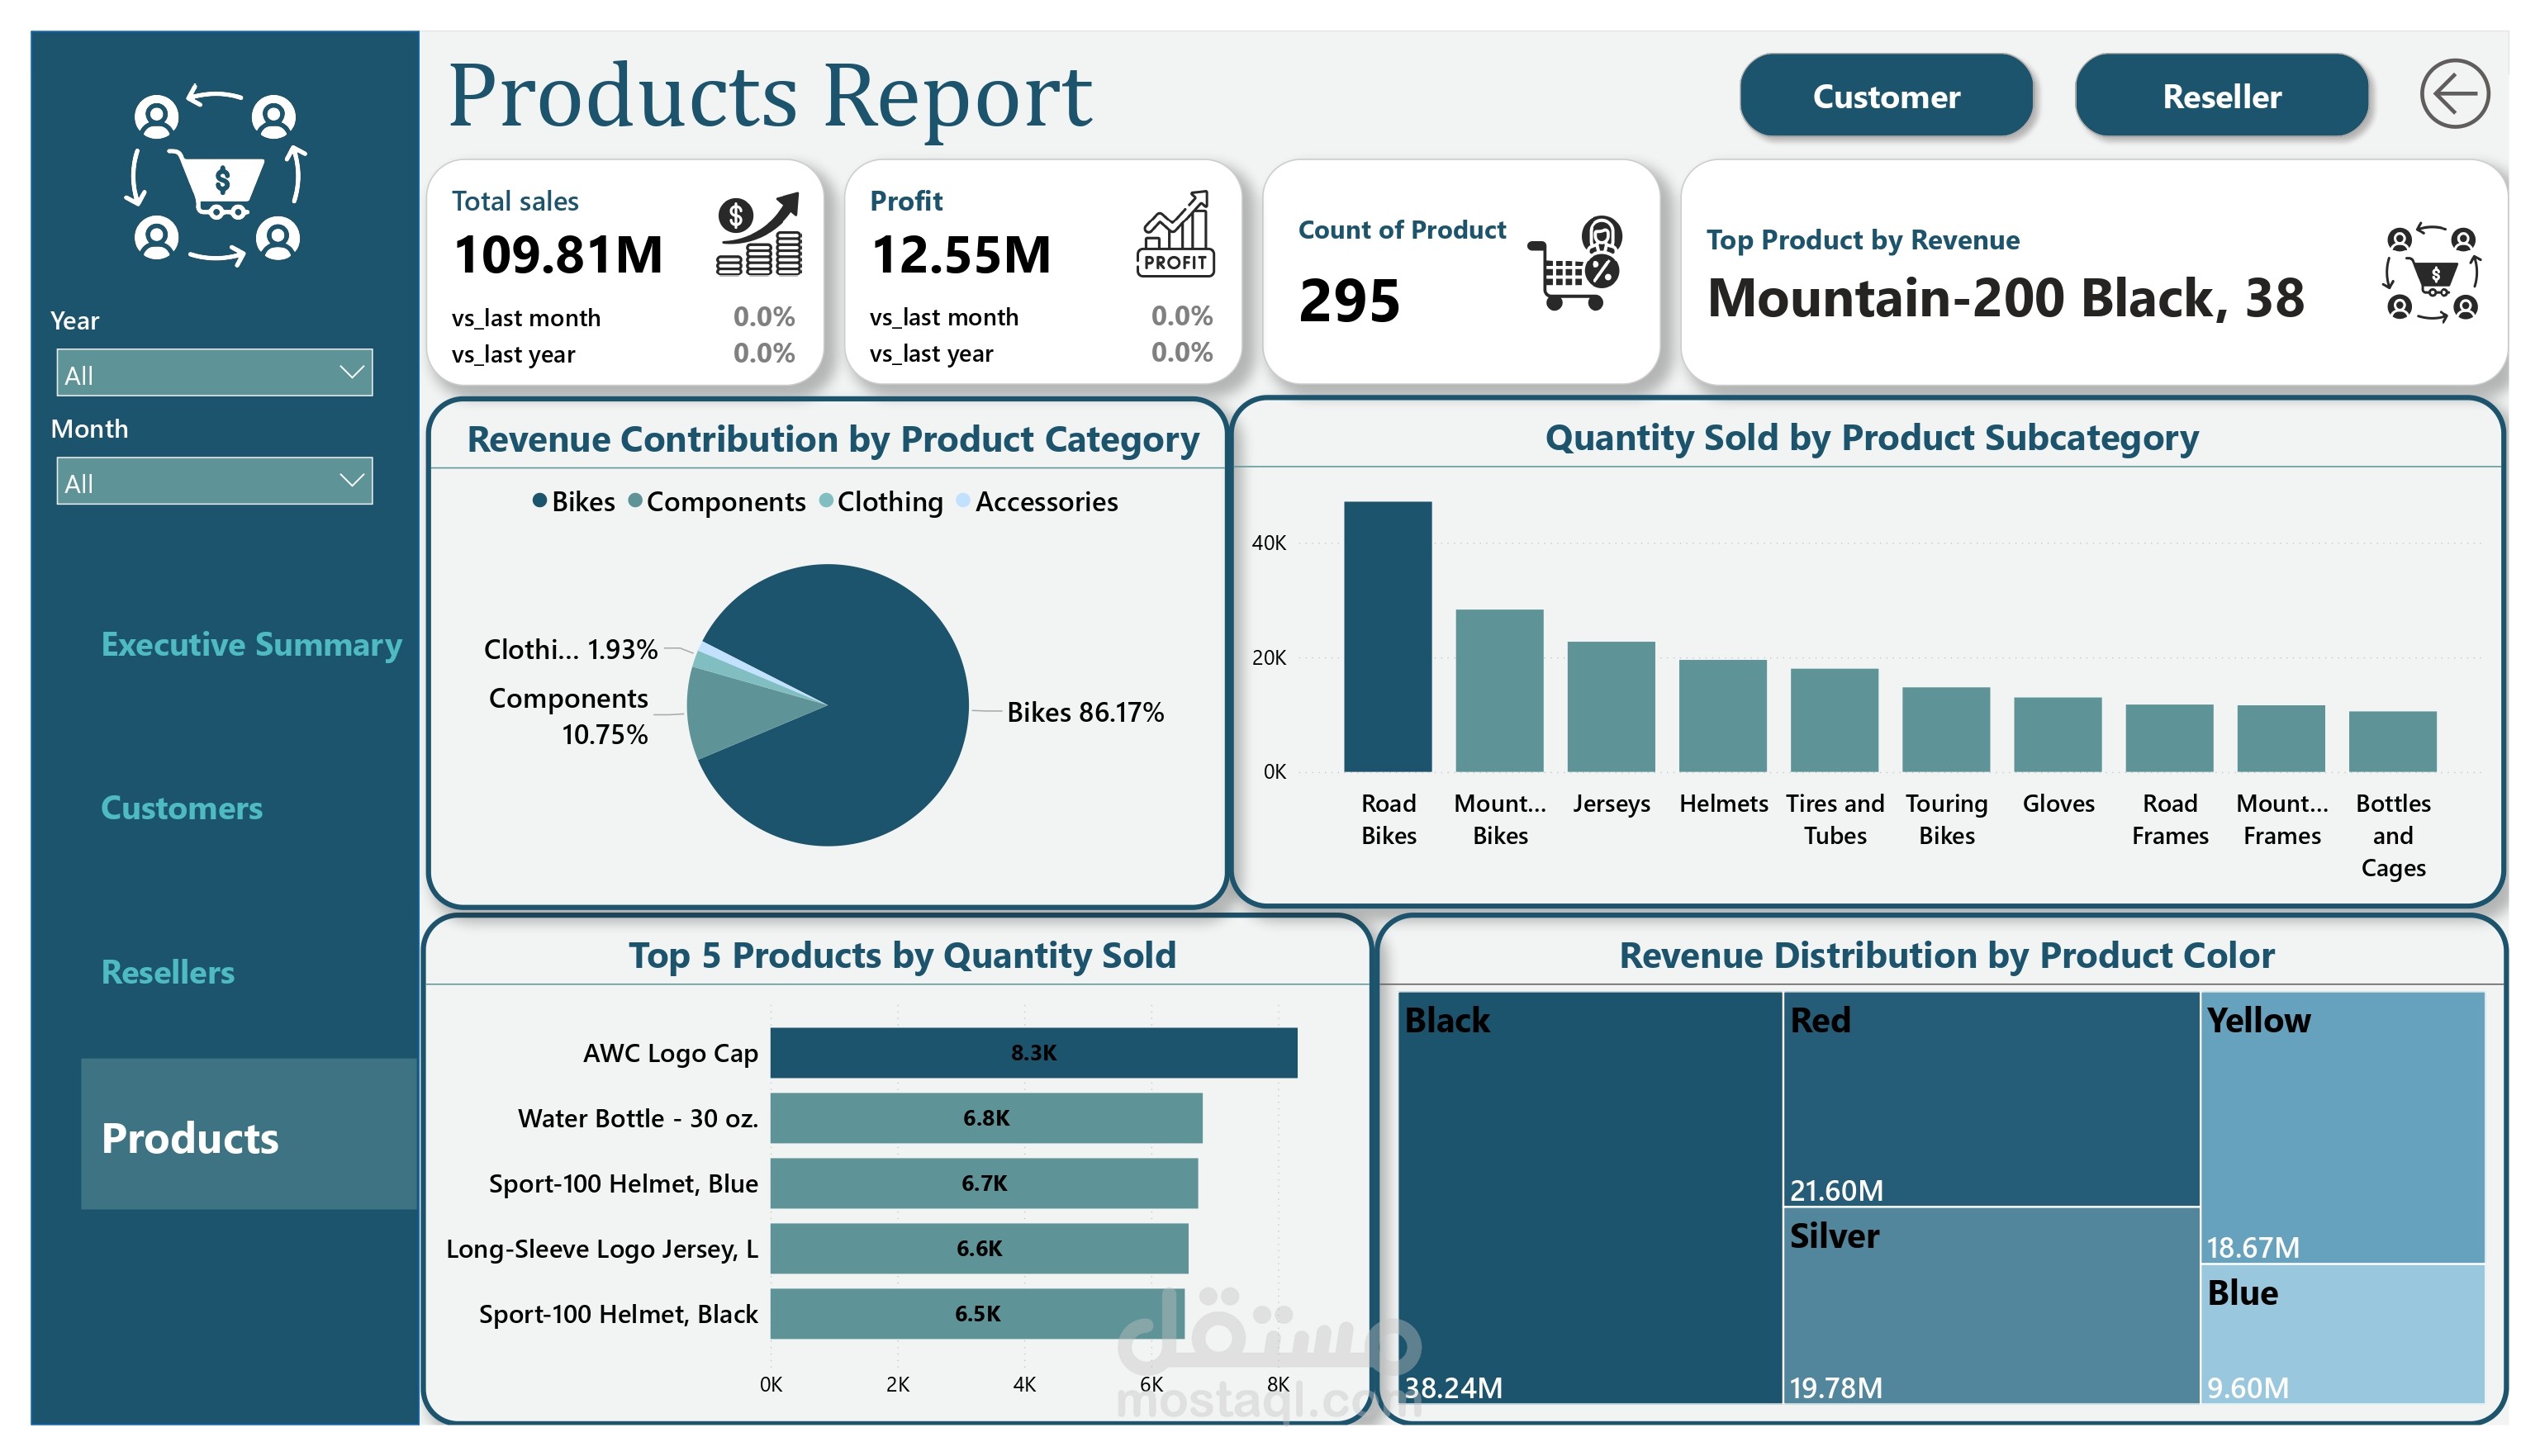
1) Total Revenue reached $109.81M, generating $12.55M profit with a Profit Margin of 11.43%.
2) Revenue بيتأثر بـ Order Volume و Average Order Value (AOV)، وده بيأكد أهمية متابعة الاتنين مع بعض لفهم performance.
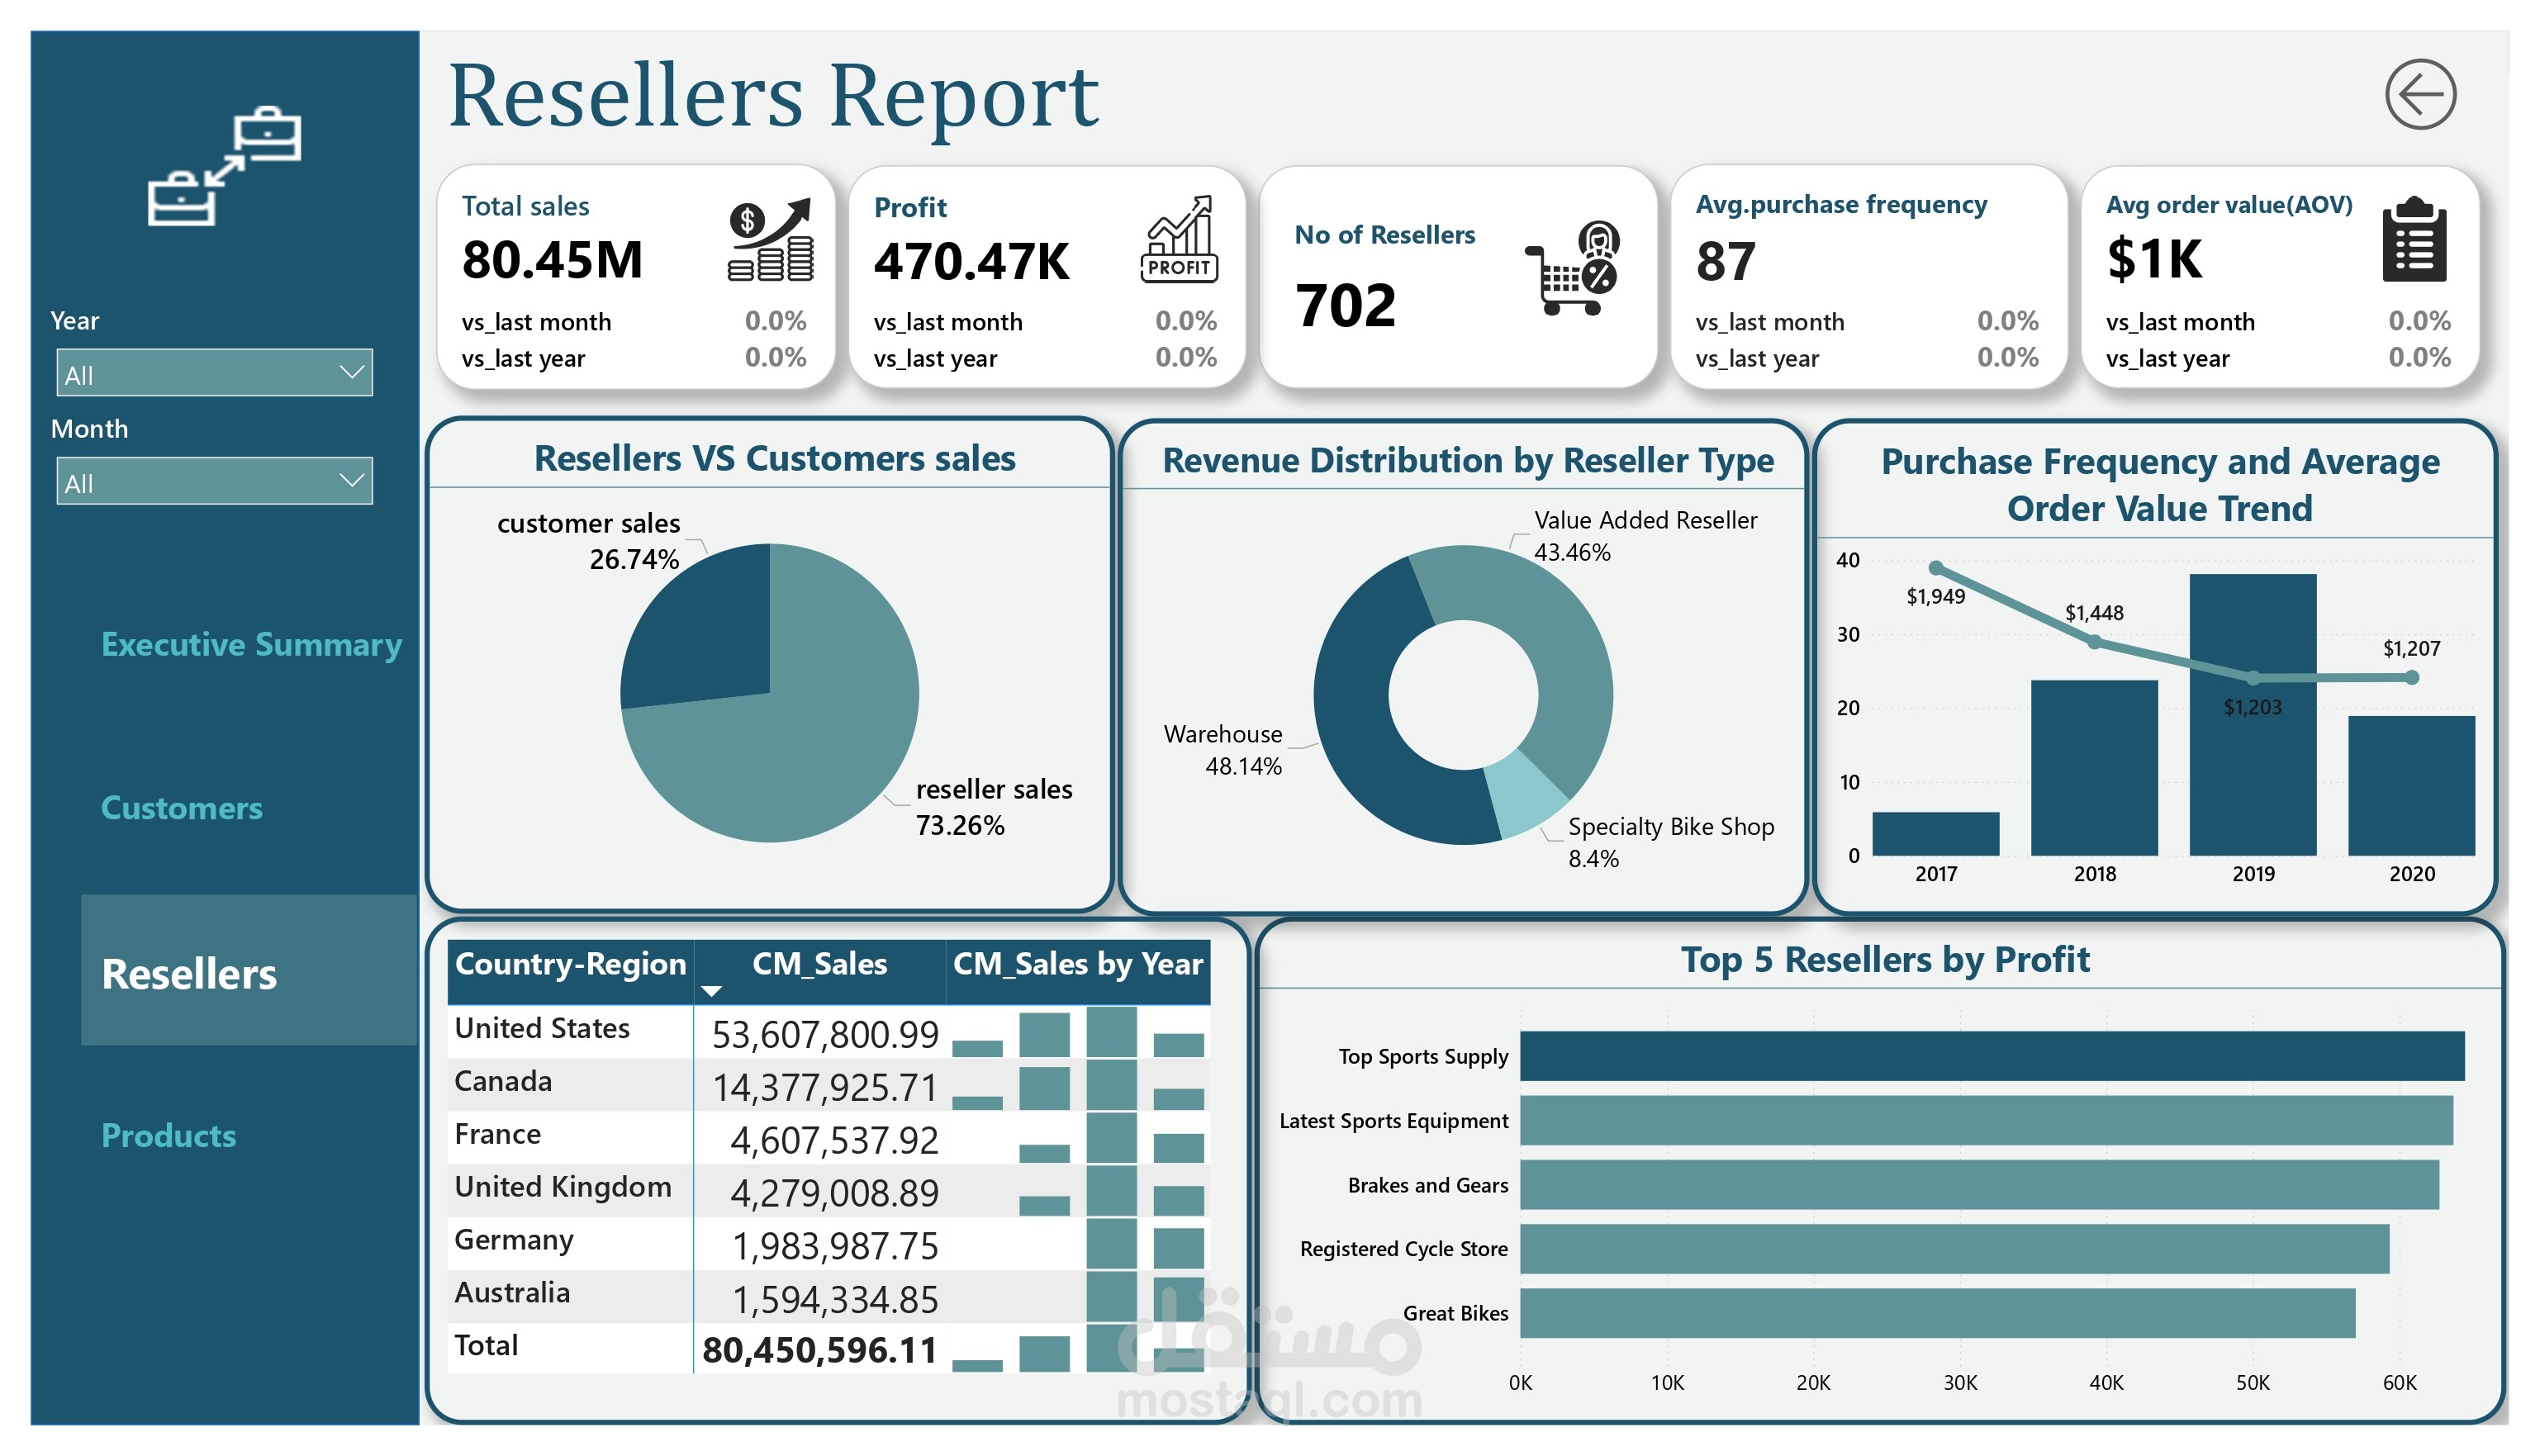
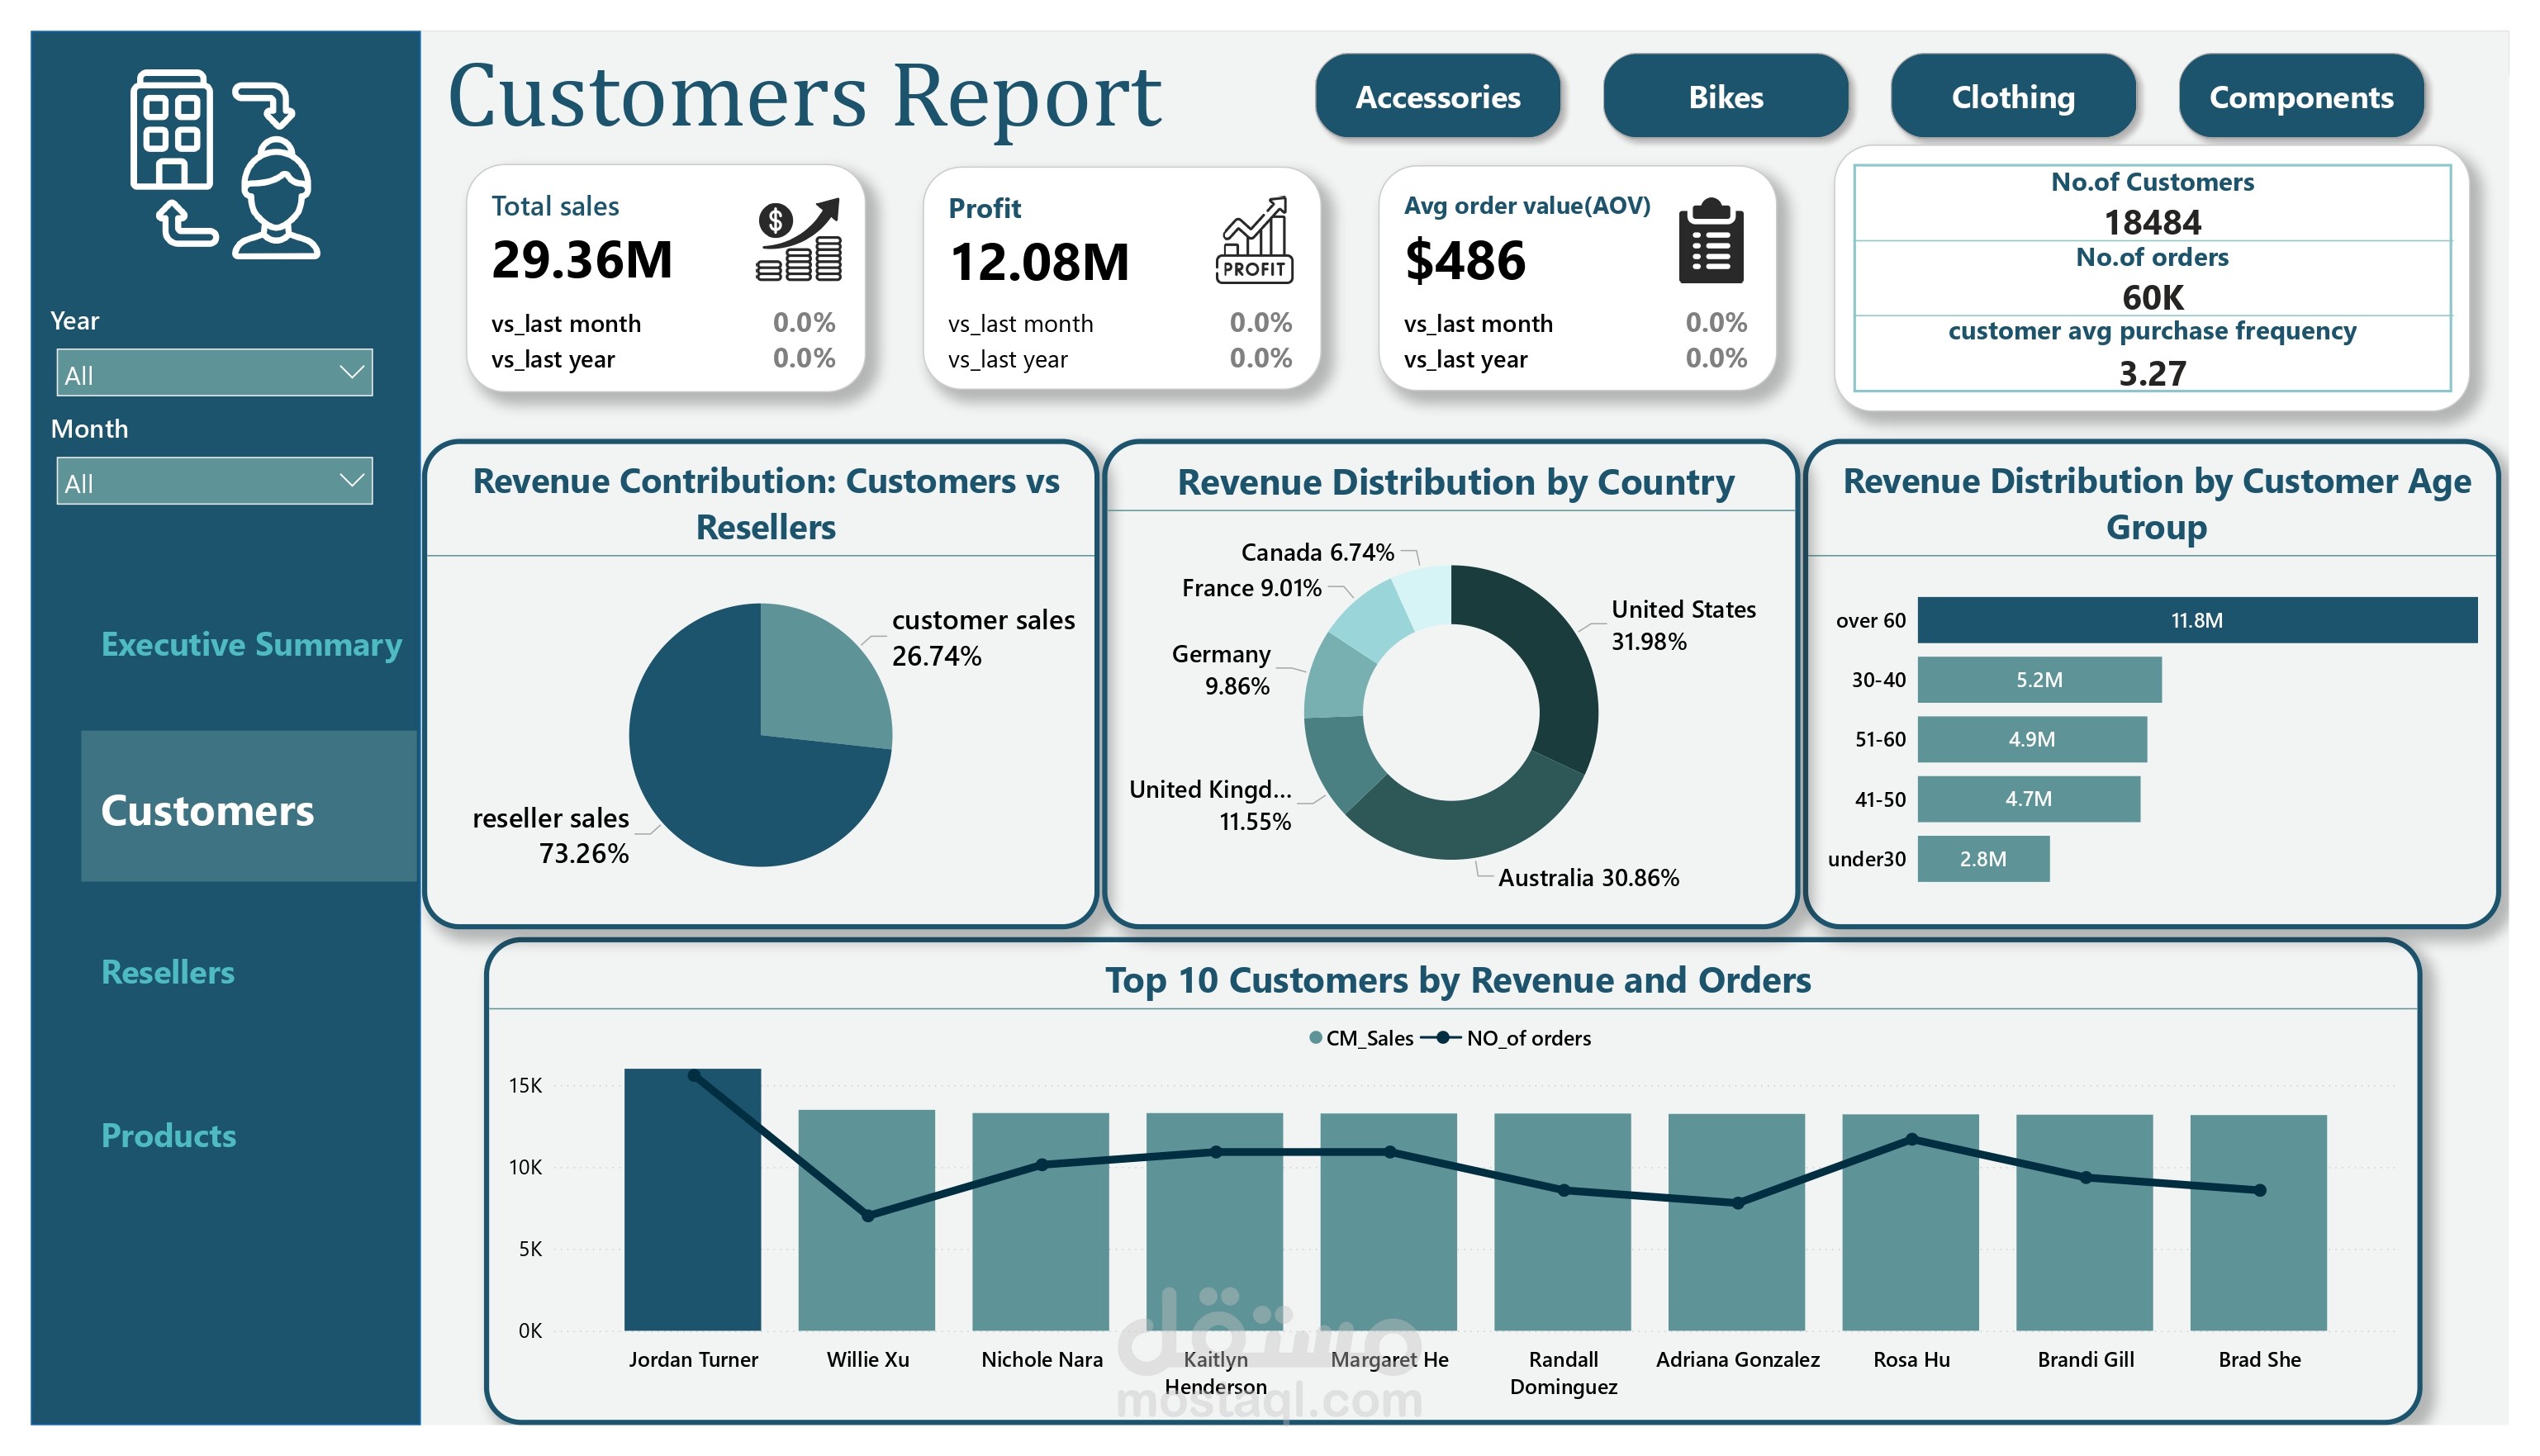
3) Resellers ساهموا بنسبة 73.26% من إجمالي revenue، بينما Customers ساهموا بـ 26.74% فقط، وده يوضح strong dependency على reseller channel.
4) Resellers كان عندهم purchase frequency أعلى، لكن profit per transaction أقل مقارنة بال direct customers، وده يوضح اختلاف profitability بين channels.
5) Category بتاعت Bikes ساهمت بنسبة 86.17% من إجمالي revenue، وده يوضح إن البزنس heavily dependent على category واحدة.
6) United States كانت أعلى performing market وساهمت بأكبر share من revenue.
7) Note that عدد قليل من products كانوا مسؤولين عن نسبة كبيرة من إجمالي revenue.
8) Customer analysis وضّح إن الفئات العمرية الأكبر contributed more revenue، وده يدل على higher customer value.
9) Trends بتاعت AOV و Purchase Frequency أظهرت changes في customer buying behavior مع الوقت، وده أثر بشكل مباشر على revenue.
?️ What I implemented :
Data cleaning and transformation using Power Query
• Built a proper data model using fact and dimension tables
• Created advanced DAX measures including:
• Total Revenue Profit Profit Margin % Average Order Value (AOV) Purchase Frequency
• Designed interactive dashboards including:
- Executive Summary
- Customer Analysis
- Reseller Performance
- Product Performance
• Added slicers and filters for dynamic and interactive analysis?
? Skills Applied :
Power BI • Advanced DAX • Data Modeling • Data Visualization • Business Analysis • KPI Development • Dashboard Design