Financial Performance Analysis Dashboard (Excel)
تفاصيل العمل
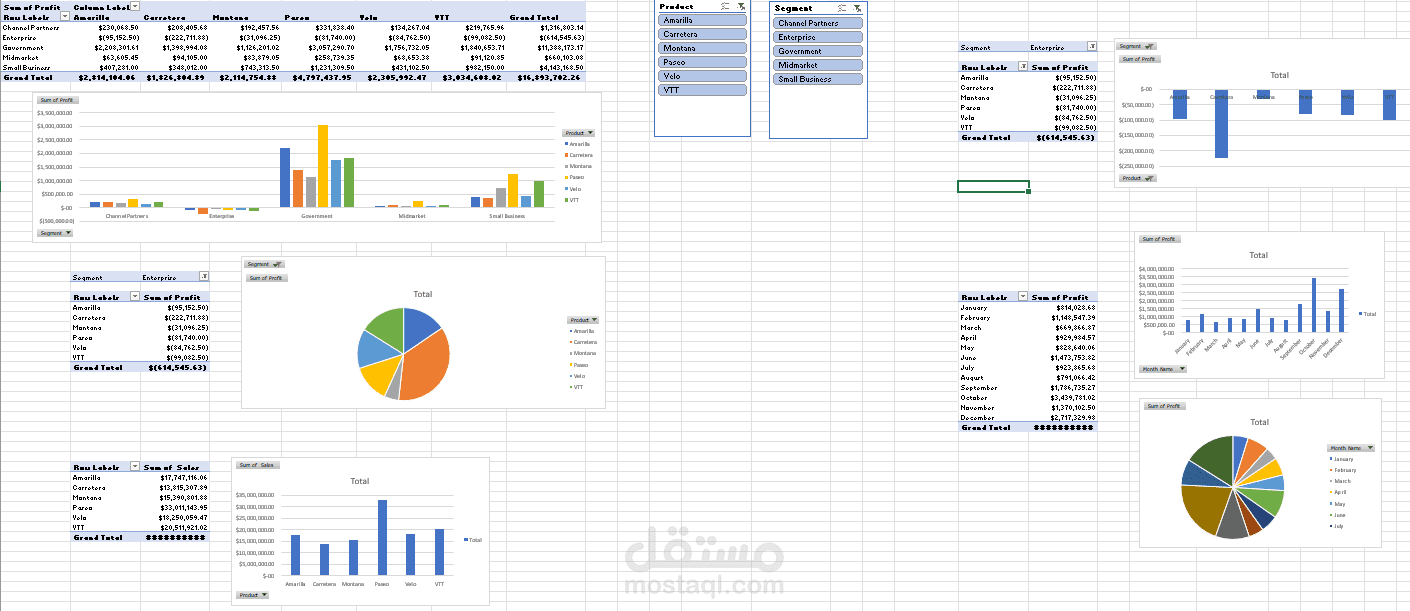
This project focuses on analyzing financial performance using Microsoft Excel to transform raw financial data into clear, decision-ready insights.
The dashboard was designed to help track revenue, profit, and overall business performance while identifying trends and areas for improvement.
What I did:
Cleaned and structured financial data
Built a dynamic Excel dashboard for performance tracking
Created visualizations to simplify financial metrics
Key Features:
Tracking total revenue, total profit, and key financial KPIs
Profit analysis across different segments and categories
Time-based analysis to monitor financial trends
Clear comparison between different business areas
Interactive filtering for deeper analysis
Key Insights:
Certain segments generate higher profitability than others
Revenue and profit trends vary across time periods
Some areas show potential for optimization and growth
Business Value:
This dashboard helps businesses monitor financial performance, identify profit drivers, and make better strategic decisions based on data.
Tools Used:
Microsoft Excel
Project Type:
Simulated real-world financial reporting and analysis scenario.