Egypt Post Performance Analysis Dashboard (Excel)
تفاصيل العمل
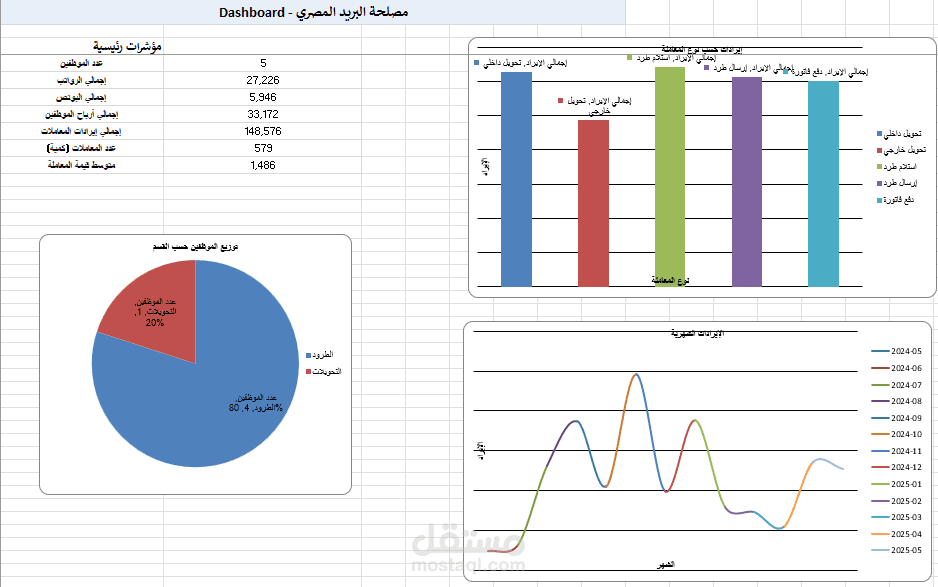
This project presents an operational performance analysis for postal services using Microsoft Excel, focusing on transforming raw data into clear, decision-support insights.
The dashboard was developed to monitor key performance indicators across postal operations, including revenues, expenses, service distribution, and workforce allocation.
What I did:
Cleaned and organized raw operational data
Designed a structured reporting layout
Built an interactive Excel dashboard for performance tracking
Key Features:
Tracking total offices, total revenues, total expenses, and net profit
Analysis of postal service types (transfers, parcels, pension services, financial services)
Monthly trend analysis to monitor operational performance over time
Employee distribution visualization to assess workforce allocation
Clear comparison between different service categories
Key Insights:
Revenue contribution varies significantly across service types
Monthly trends highlight fluctuations that may require operational adjustments
Workforce distribution may not be fully aligned with service demand
Business Value:
This dashboard enables decision-makers to monitor performance, detect inefficiencies, and optimize resource allocation based on data-driven insights.
Tools Used:
Microsoft Excel
Project Type:
Simulated real-world operational reporting scenario for postal services.