Data Analysis project on eBay Autos dataset
تفاصيل العمل

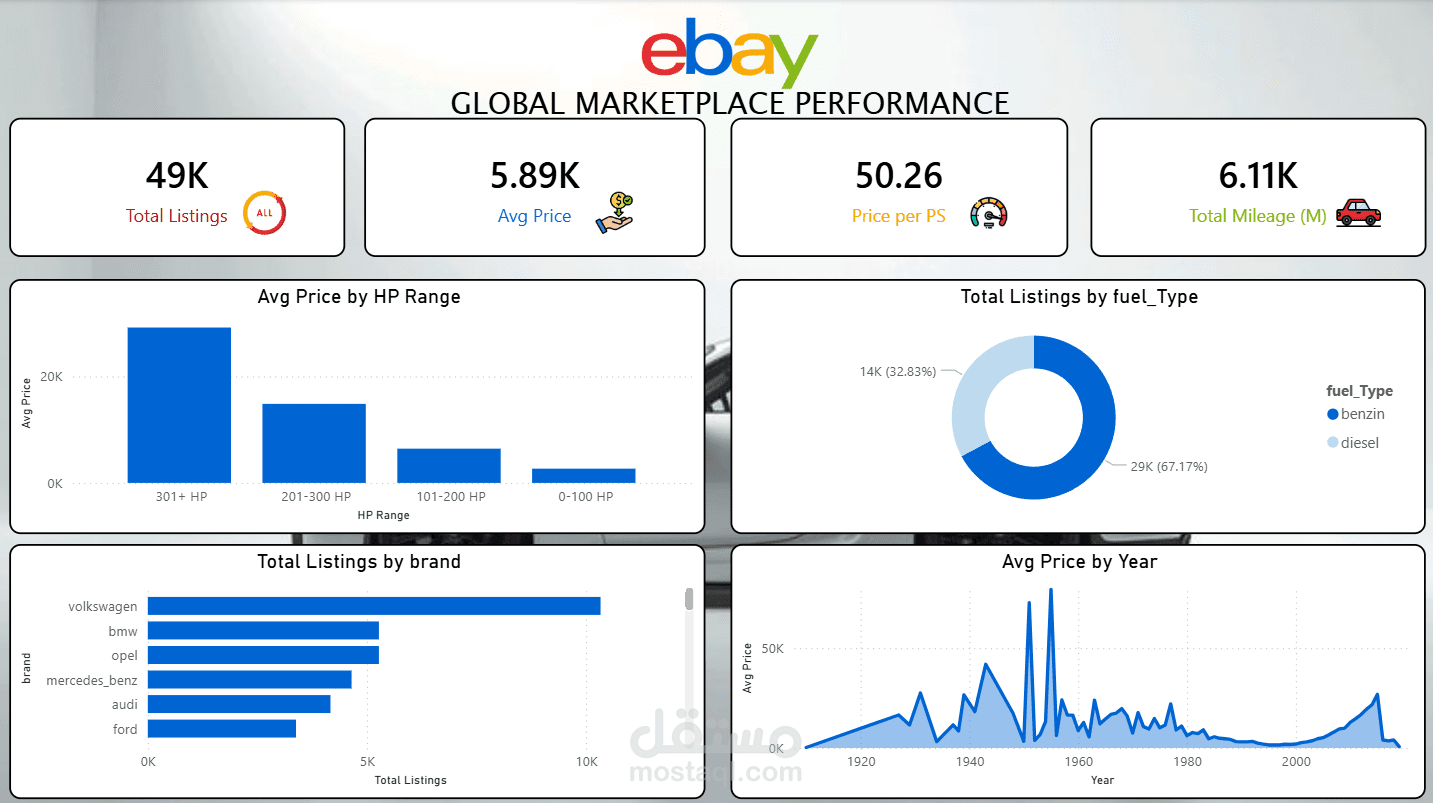
Worked with 50,000 car listings and here's what I discovered:
What I found in the raw data:
• price & odometer columns stored as text with $ and Km symbols not numbers!
• 1,421 cars listed at $0 (fake/placeholder entries)
• yearOfRegistration had impossible values like 1000 and 9999
• nrOfPictures column was 100% zeros → dropped entirely
• Missing values across vehicleType, gearbox, model, and fuelType
Key Insights after cleaning:
• Volkswagen dominates with 21% of all listings
• Audi has the highest avg price at €9,212 among top brands
• Opel has the lowest avg price at €2,941
• BMW & Mercedes buyers drive the most km before selling (130K+ km)
• 67% of cars run on benzin vs 33% diesel
• High HP cars (301+) are priced 3x more than low HP ones
Business Recommendations:
• Implement input validation to prevent invalid entries (e.g., $0 prices, unrealistic years) → improves data quality & platform trust
• Introduce a price recommendation system based on car attributes (brand, year, mileage, HP) → helps sellers price competitively
• Highlight high-demand brands like Volkswagen to increase engagement and sales
• Segment high-performance cars (301+ HP) as a premium category → unlock higher revenue opportunities
• Promote lower-demand brands (e.g., Opel) through discounts or special offers to improve sales velocity
Final output: A Power BI dashboard showing brand performance, price by HP
range, fuel type distribution & avg price trends by year.
Clean data = trustworthy insights. That's the foundation of every good analysis.