designing and developing a KPIs Dashboard using Power BI
تفاصيل العمل
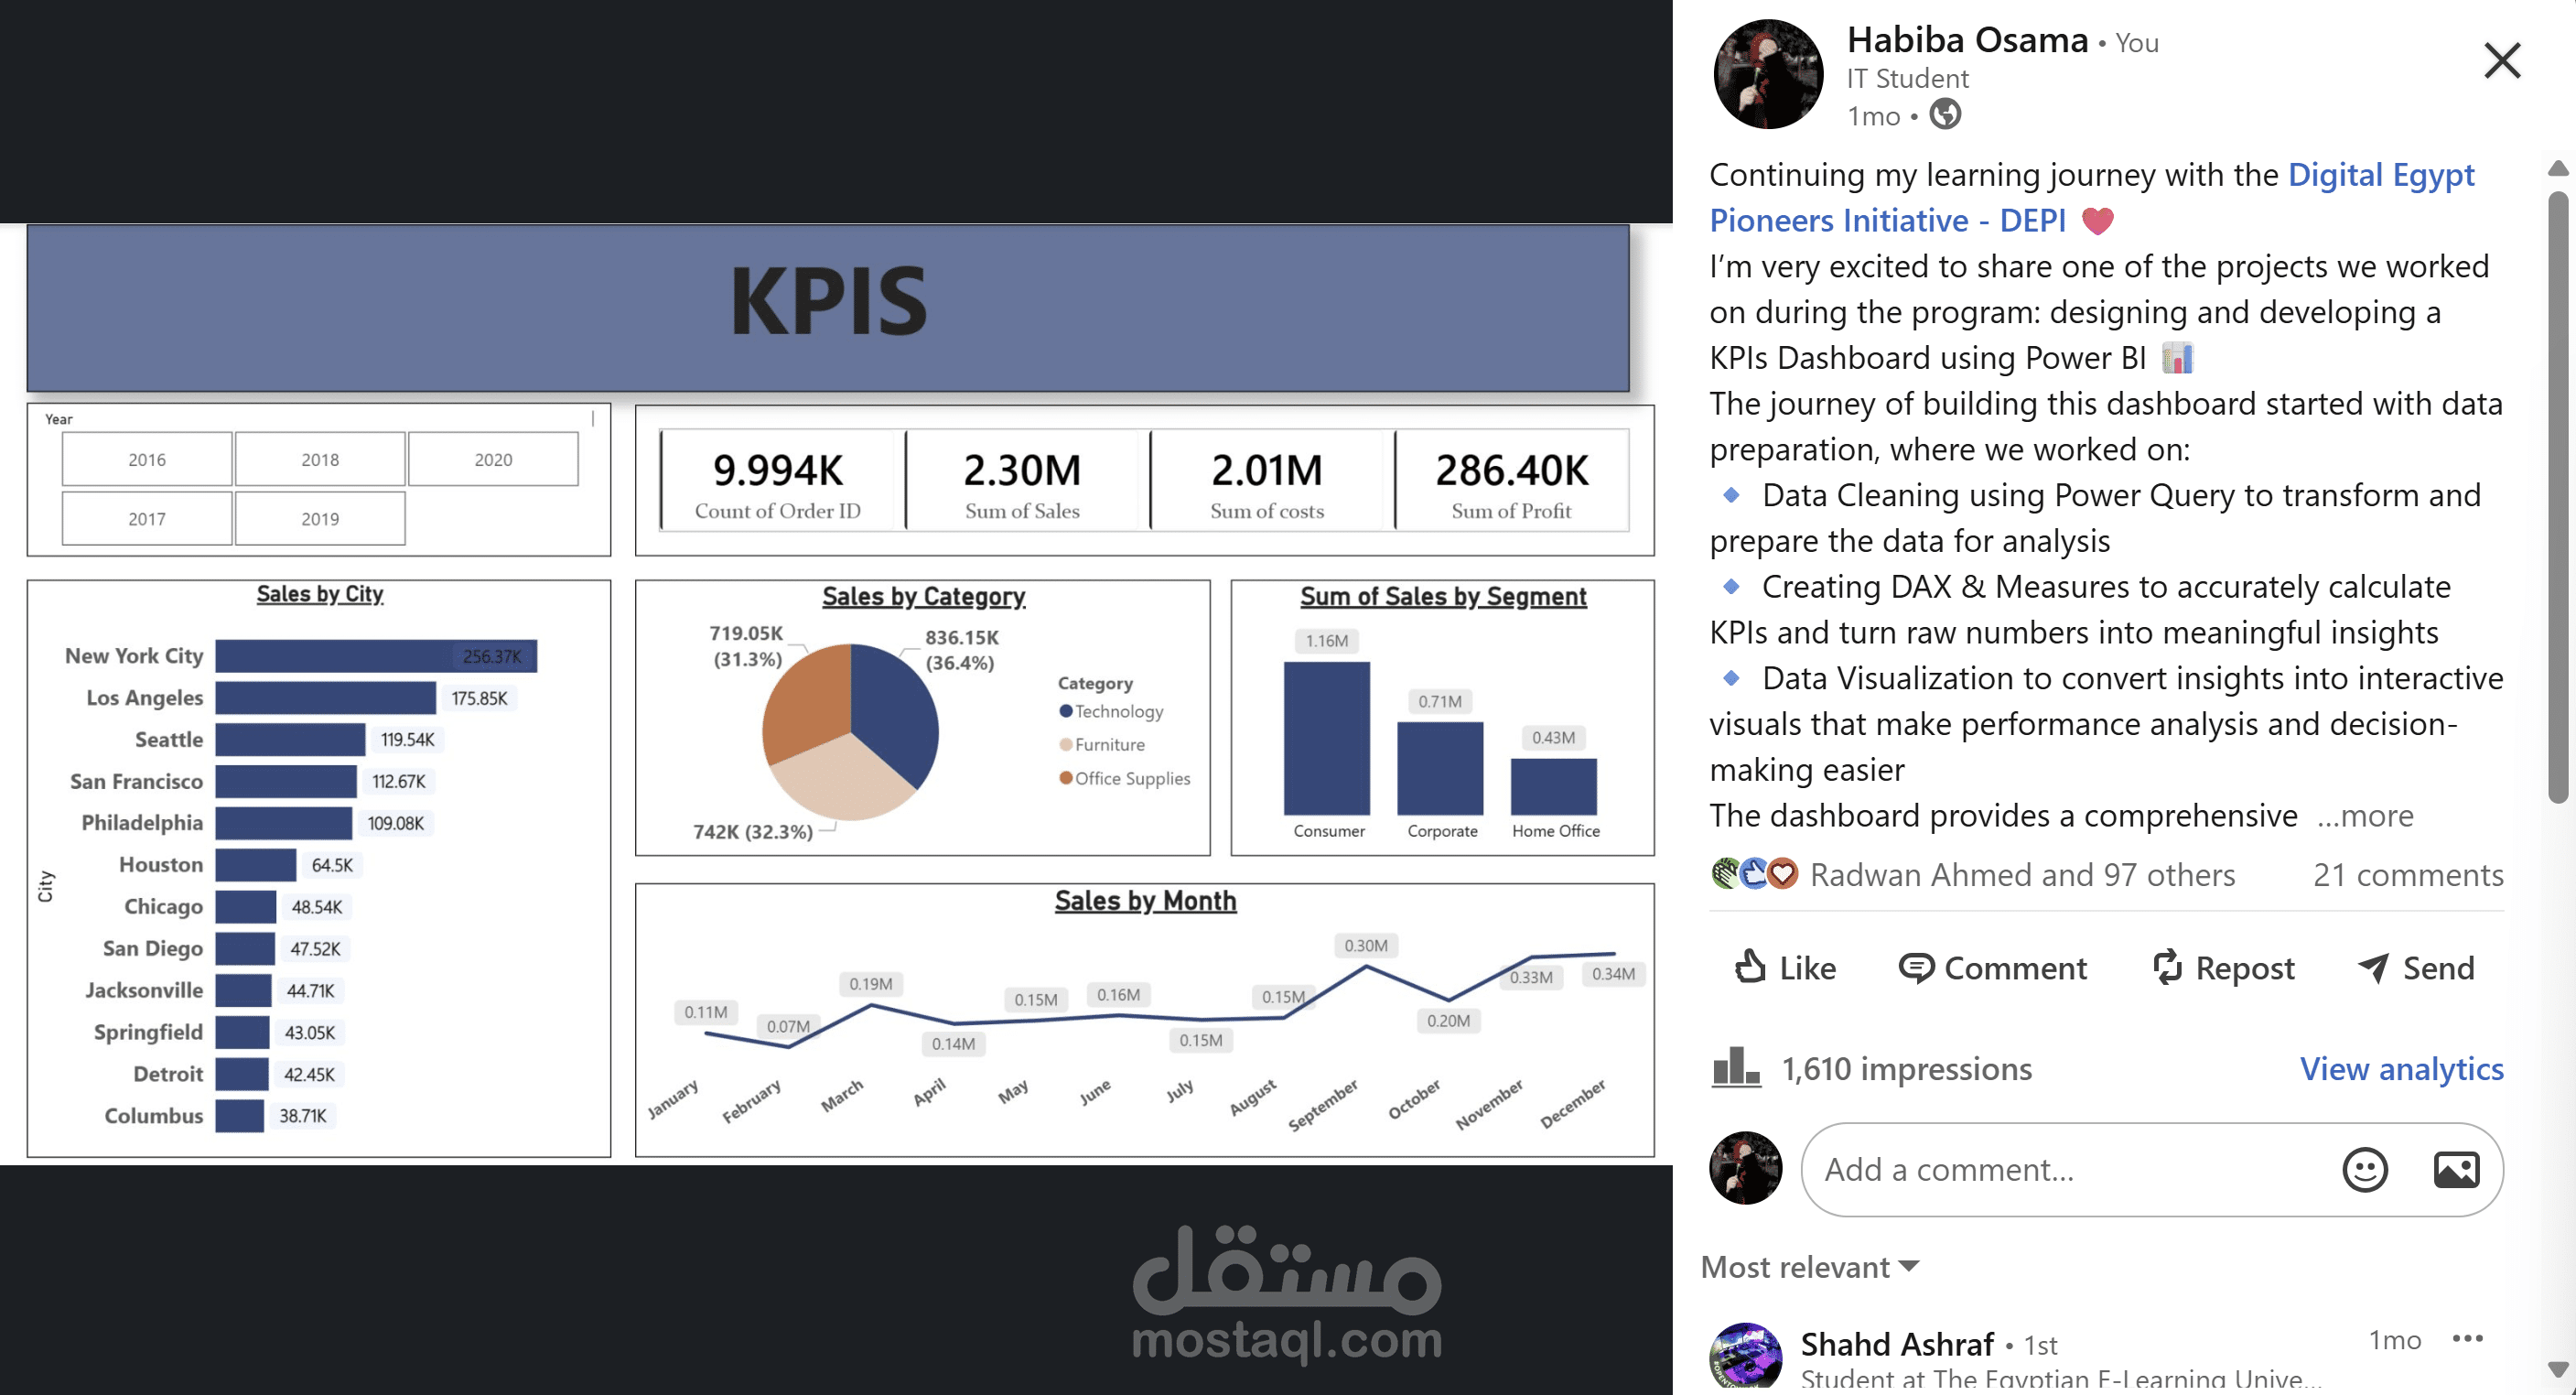
? Data Cleaning using Power Query to transform and prepare the data for analysis
? Creating DAX & Measures to accurately calculate KPIs and turn raw numbers into meaningful insights
? Data Visualization to convert insights into interactive visuals that make performance analysis and decision-making easier
The dashboard provides a comprehensive overview of:
▪️ Total Sales – Costs – Profit
▪️ Sales analysis by City, Category, and Segment
▪️ Monthly sales trends to track performance changes throughout the year
▪️ Order count as a key indicator of business activity