DataAnalyst / Tableau Developer
تفاصيل العمل
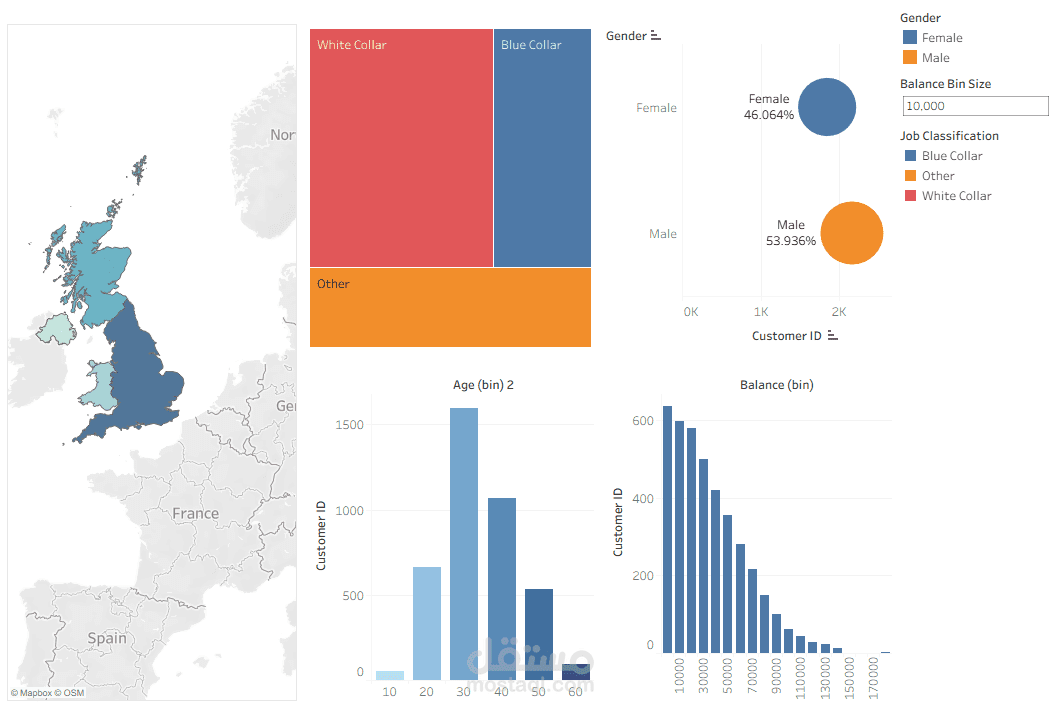
In this project, I utilized Tableau to build a high-performance sales dashboard that provides a 360-degree view of business health. This project showcases my ability to create professional-grade data stories that are both visually appealing and technically sound.
Key Features of the Tableau Project:
Data Integration: Successfully blended multiple data sources to create a unified view of Sales, Products, and Customer Territories.
Advanced Level of Detail (LOD): Used Tableau’s calculated fields and LOD expressions to ensure accurate revenue calculations regardless of the filter depth.
Interactive Storyboarding: Designed a "drill-down" experience where users can click on a specific region (like Australia) or category (like Bikes) to update the entire dashboard instantly.
Visual Best Practices: Applied data visualization principles to choose the right charts—utilizing trend lines for temporal data and ranked bar charts for category performance.
Custom Formatting: Created a clean, corporate-style layout with custom tooltips that provide additional context without cluttering the main view.
Technical Toolkit:
Tableau Desktop / Tableau Public
Calculated Fields & Parameters
Data Blending & Joining
AdventureWorks Business Dataset