E-commerce Sales Analysis Dashboard
تفاصيل العمل
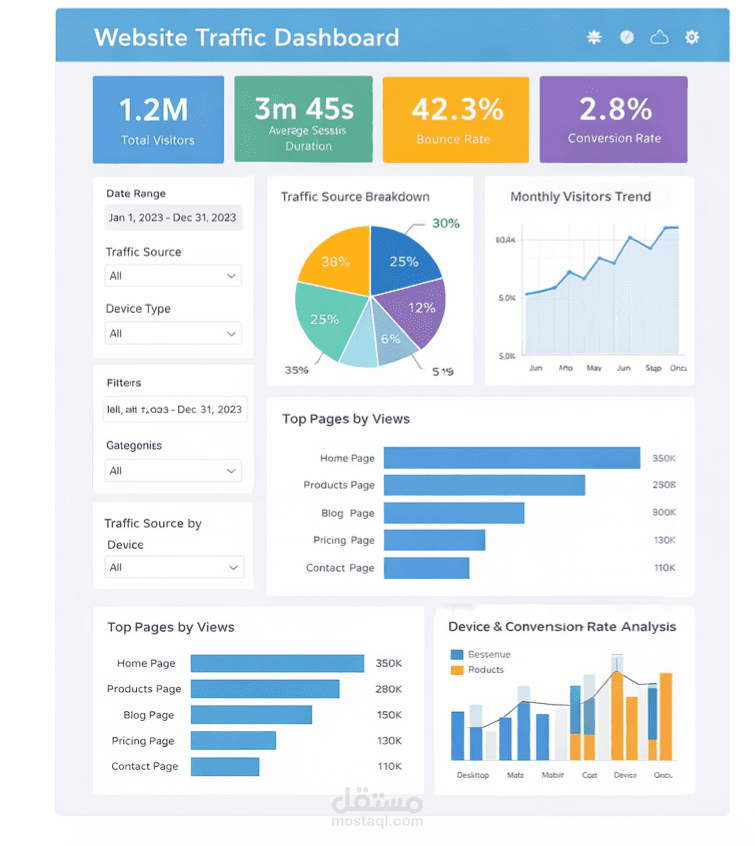
In this project, I analyzed e-commerce sales data to evaluate business performance and identify growth opportunities.
The data was prepared and cleaned using Excel and SQL, followed by in-depth analysis to track key metrics such as total sales, number of orders, average order value, and return rate. I built an interactive dashboard using Power BI to visualize sales trends, top-performing products, and regional performance.
This dashboard helps decision-makers monitor performance, identify trends, and make data-driven business decisions.
Tools used: Excel, SQL, Power BI