Sales Data Analysis
تفاصيل العمل
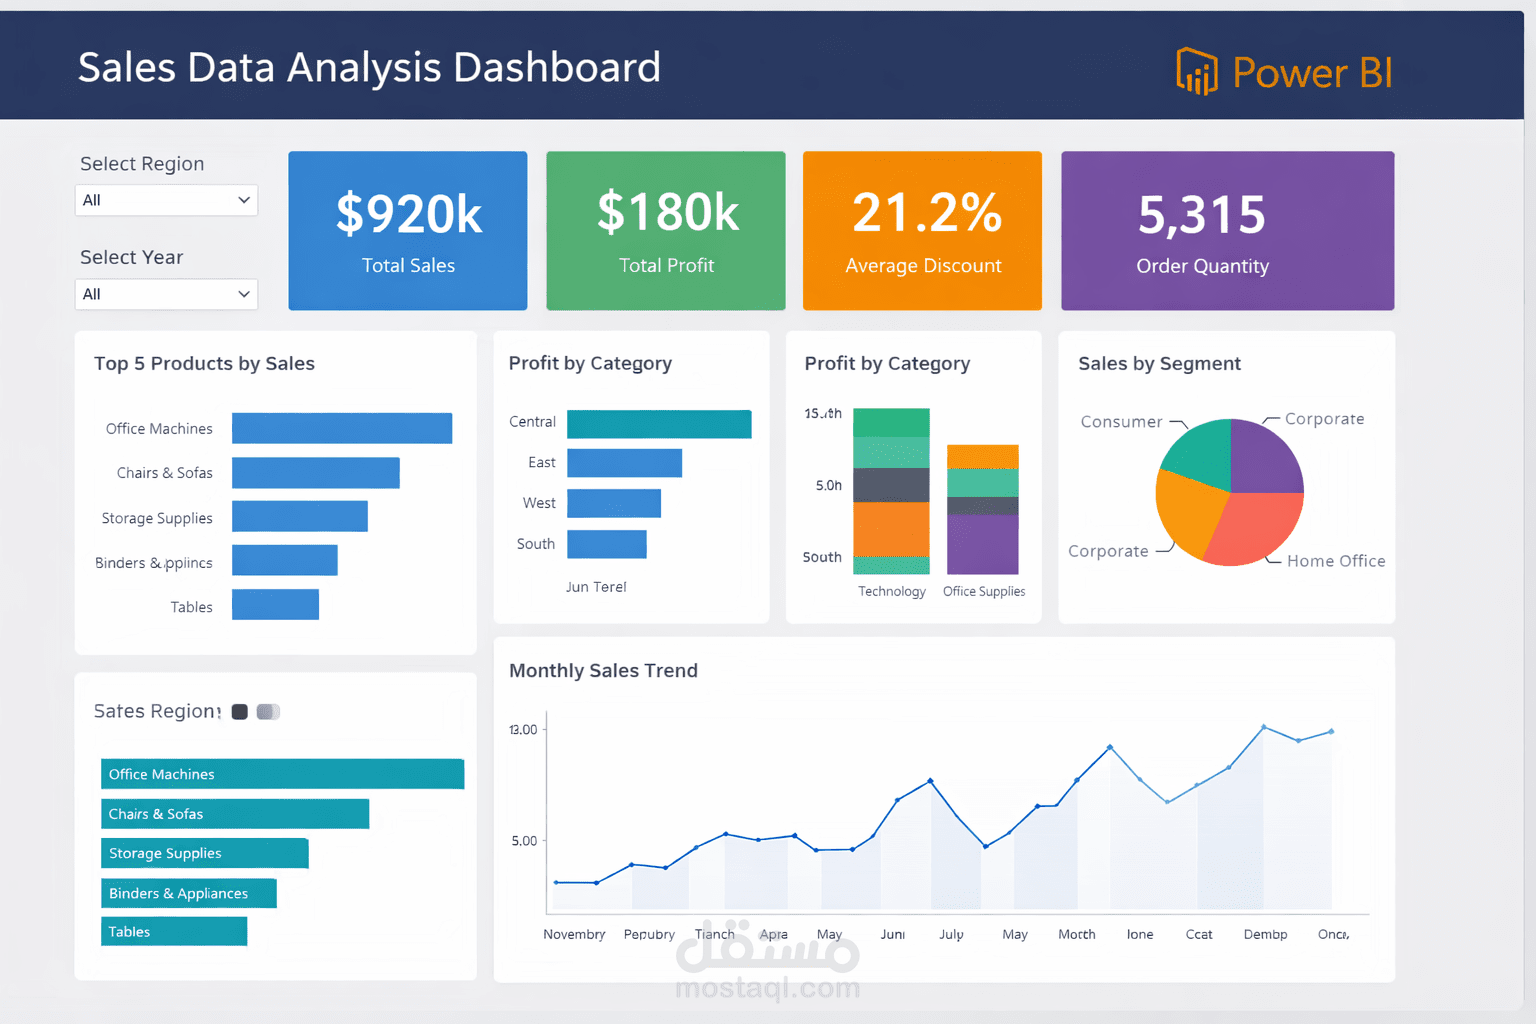
This project focuses on analyzing raw data and transforming it into meaningful insights using Power BI.
I started by cleaning and preparing the dataset using Excel and SQL to ensure data accuracy and consistency. Then, I performed data analysis to identify key trends and patterns.
Finally, I built an interactive dashboard in Power BI that includes:
Key performance indicators (KPIs)
Data visualizations (charts and graphs)
Filters for dynamic analysis
The dashboard helps users easily understand the data and supports better decision-making.
Tools used: Excel, SQL, Power BI