Interactive Sales Performance & Profitability Dashboard
تفاصيل العمل
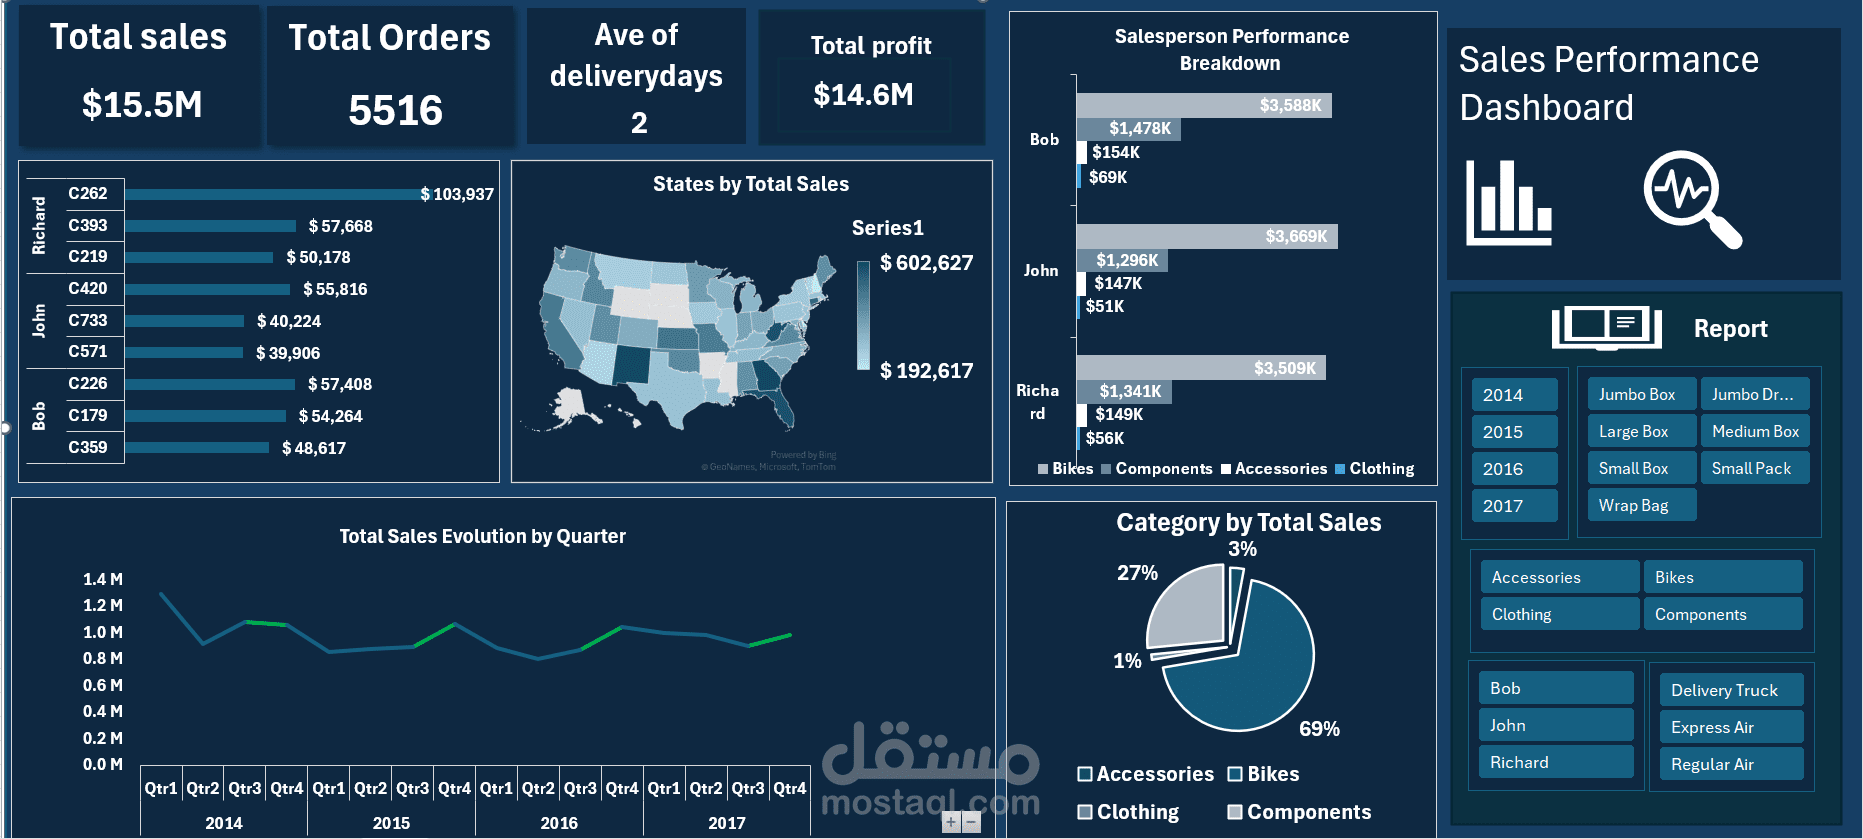
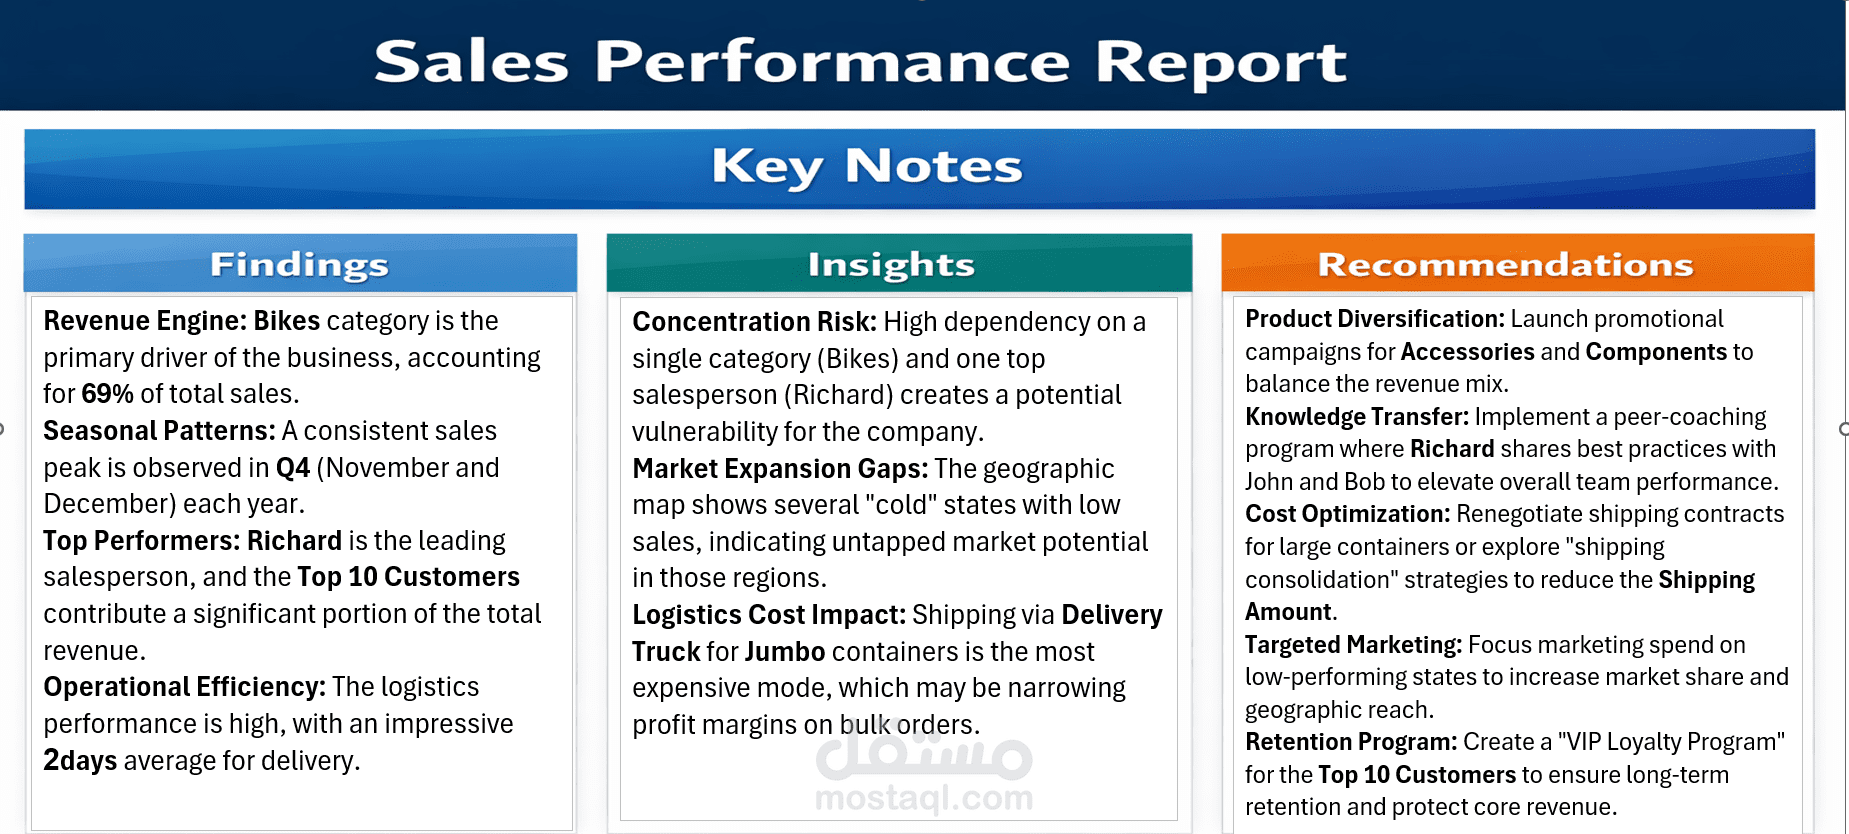
This project features a fully interactive Sales Performance Dashboard designed to transform raw business data into clear, actionable insights. It provides a comprehensive executive view of critical KPIs, including total revenue of $15.5M, overall profitability, and average delivery times. Through dynamic visualizations such as time-series trend analysis from 2014 to 2017, geospatial sales distribution across states, and detailed salesperson performance breakdowns, stakeholders can easily monitor business health. The dashboard is equipped with user-friendly interactive slicers—allowing seamless filtering by year, product category, shipping method, and personnel—empowering decision-makers to explore specific metrics and optimize their sales strategies effectively.