Netflix Data Analysis Dashboard
تفاصيل العمل
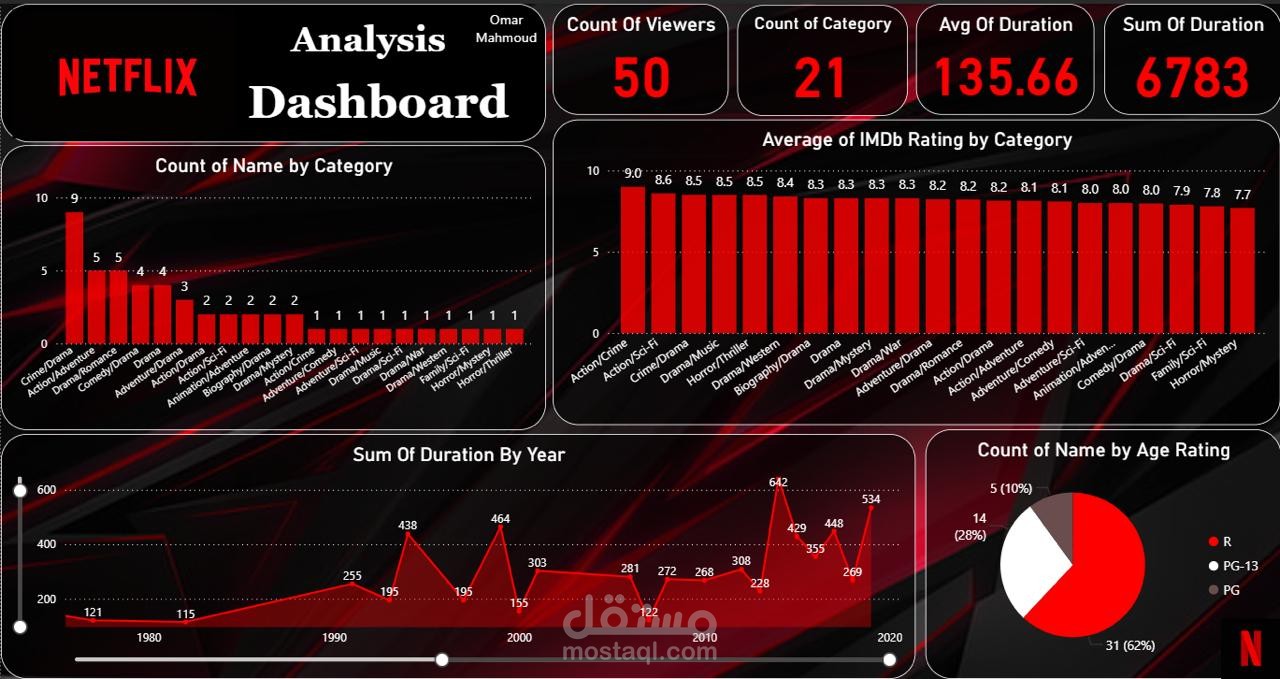
This dashboard provides an interactive analysis of Netflix content using Power BI. It highlights key metrics such as total viewers, number of categories, average duration, and total duration.
The dashboard includes:
Distribution of content by category
Average IMDb ratings across different genres
Trends in total duration over the years
Breakdown of content by age rating
The goal of this project is to uncover patterns in Netflix data and present insights in a clear, visually engaging way to support data-driven decisions.