Titanic Dataset Analysis using Power BI
تفاصيل العمل
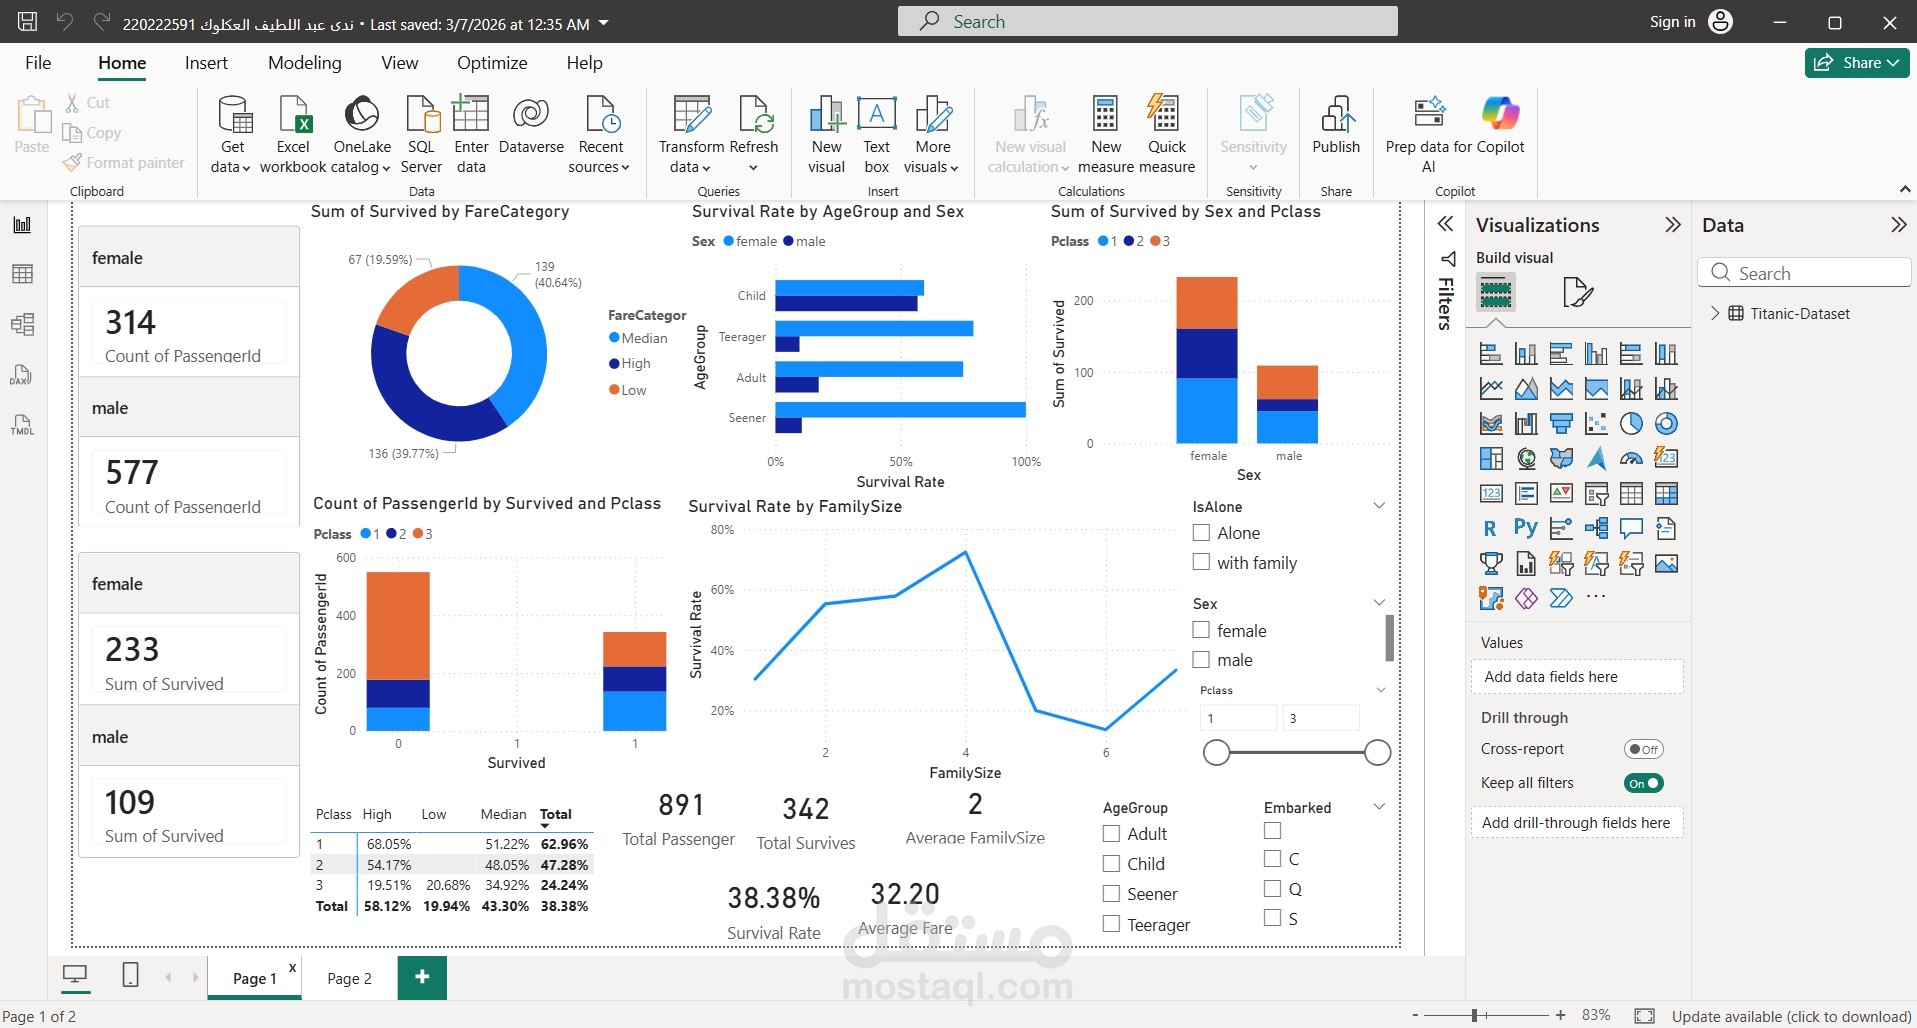

I developed a data analysis project using the famous Titanic dataset to explore and identify the key factors that influenced passenger survival. The project was implemented using Power BI to build an interactive and insightful dashboard.
Tasks performed:
Data cleaning and preprocessing
Exploratory Data Analysis (EDA)
Data modeling and relationship building
Creating DAX measures for calculations and insights
Designing an interactive dashboard with visualizations including:
Survival analysis by gender and age
Passenger class (Pclass) impact on survival
Fare distribution and its relationship with survival
Interactive filters and slicers for dynamic exploration
Tools & Technologies:
Power BI, DAX, Data Visualization
Outcome:
An interactive dashboard that provides clear insights into the factors affecting passenger survival, enabling easy and effective data-driven understanding.