Sales Performance Dashboard | Power BI
تفاصيل العمل
Performed data cleaning and transformation using Power Query (ETL process).
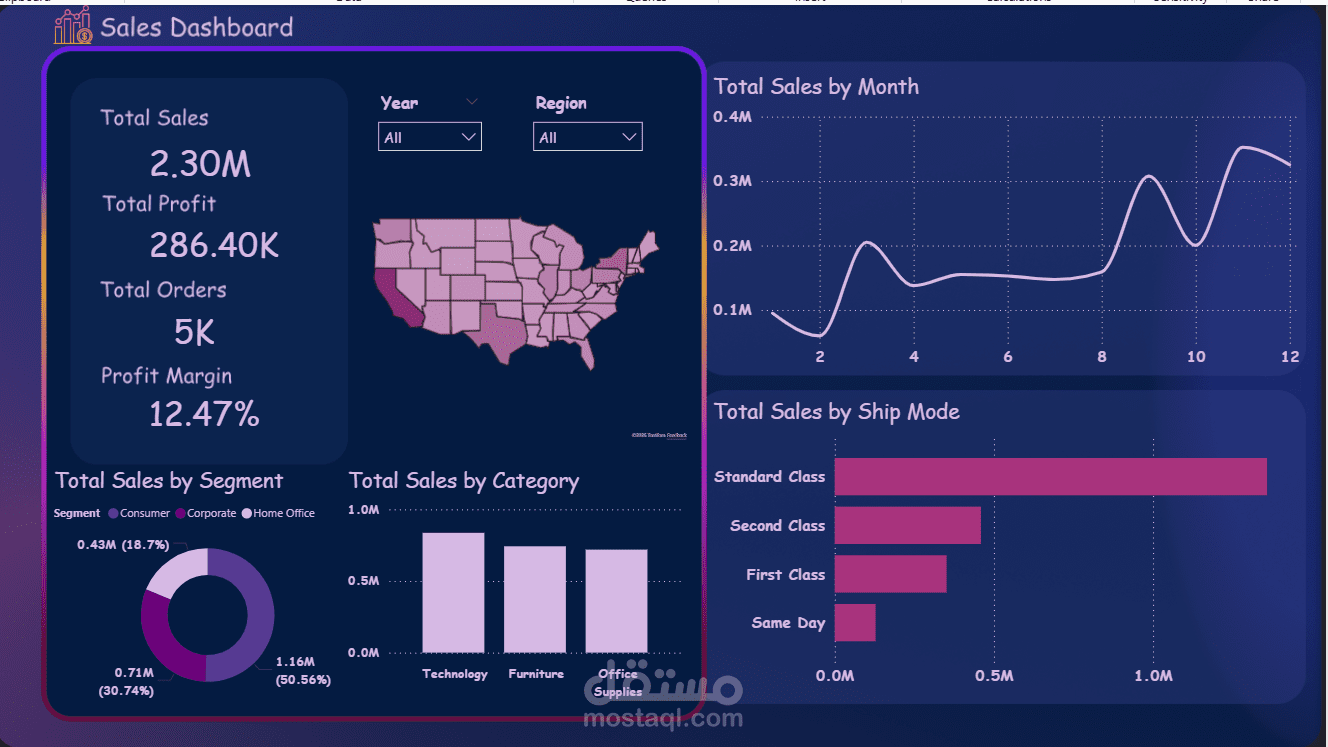
• Designed relational data model and created DAX measures for Total Sales, Profit,
Orders, and Profit Margin (12.47%).
• Built interactive dashboard with filtering by Year and Region to enable performance
analysis.
• Analyzed monthly sales trends, product categories, customer segments, and shipping
modes.
• Integrated geographic visualization to evaluate regional sales performance and
executive KPIs.